Fig. 6
Download original image
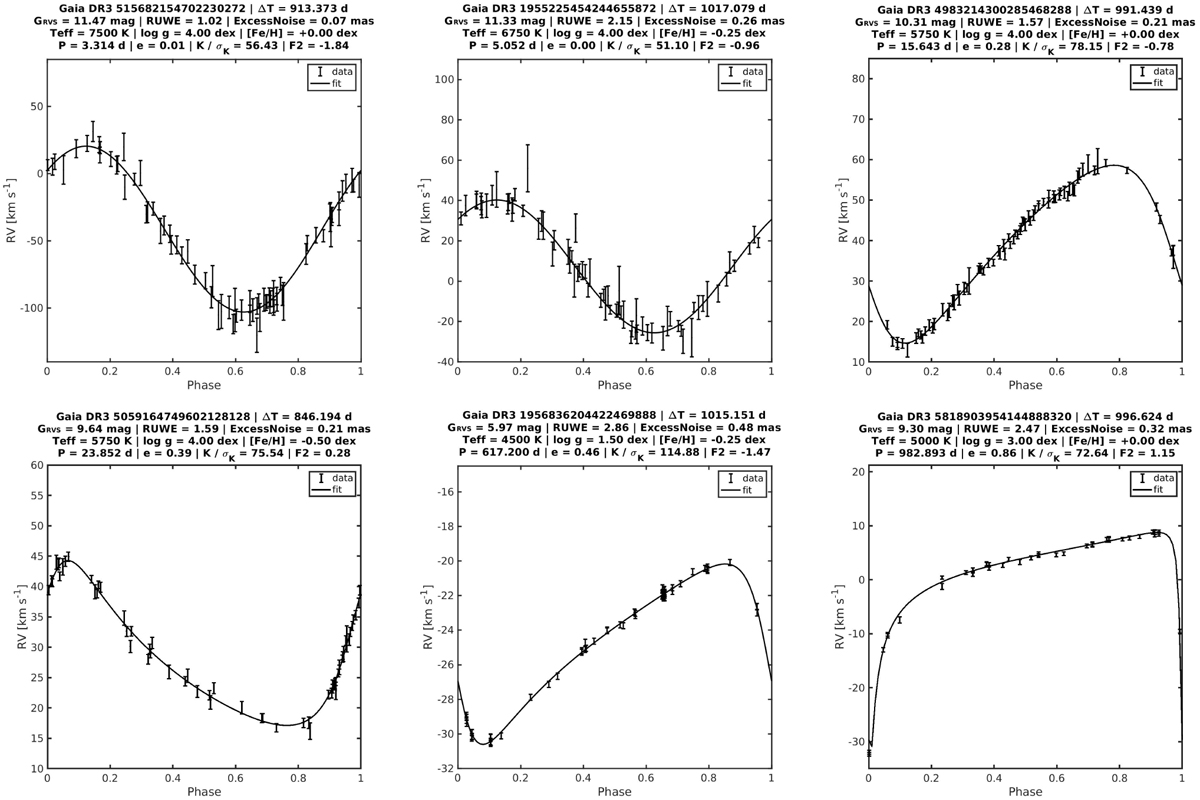
Several examples illustrative of the output of the pipeline for SB1-type solutions. Each panel concerns an object whose Gaia name is given in the header. Each of the panels shows the phase diagram containing the folded RVs (data points at the centre of the ±1σ error bars) along with the fitted orbital solution. The header gives also the time span covered by the time series (ΔT). The second line gives the ![]() magnitude of the object, the astrometric ruwe and the astrometric excess noise, whereas the third line concerns the physical parameters identifying the template used. The last line indicates the period, the eccentricity, the significance, and the statistic F2 related to the adopted solution. The objects are ordered by increasing period.
magnitude of the object, the astrometric ruwe and the astrometric excess noise, whereas the third line concerns the physical parameters identifying the template used. The last line indicates the period, the eccentricity, the significance, and the statistic F2 related to the adopted solution. The objects are ordered by increasing period.
Current usage metrics show cumulative count of Article Views (full-text article views including HTML views, PDF and ePub downloads, according to the available data) and Abstracts Views on Vision4Press platform.
Data correspond to usage on the plateform after 2015. The current usage metrics is available 48-96 hours after online publication and is updated daily on week days.
Initial download of the metrics may take a while.