Open Access
Fig. 49
Download original image
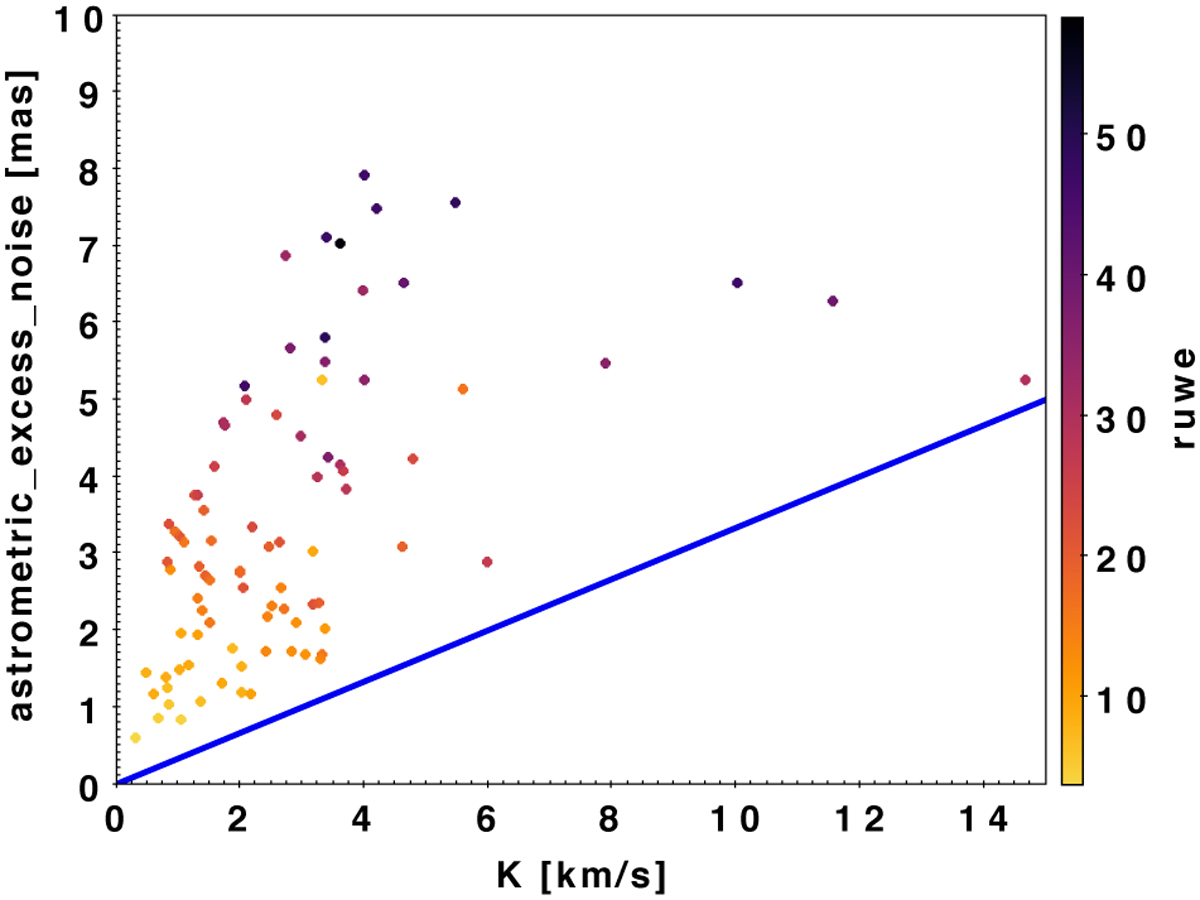
astrometric_excess_noise as a function of the semiamplitude, K, for the selected subsample. The data points are coloured according to the ruwe. The blue line indicates the separation above which the K is lower than three times the excess noise.
Current usage metrics show cumulative count of Article Views (full-text article views including HTML views, PDF and ePub downloads, according to the available data) and Abstracts Views on Vision4Press platform.
Data correspond to usage on the plateform after 2015. The current usage metrics is available 48-96 hours after online publication and is updated daily on week days.
Initial download of the metrics may take a while.