Fig. 47
Download original image
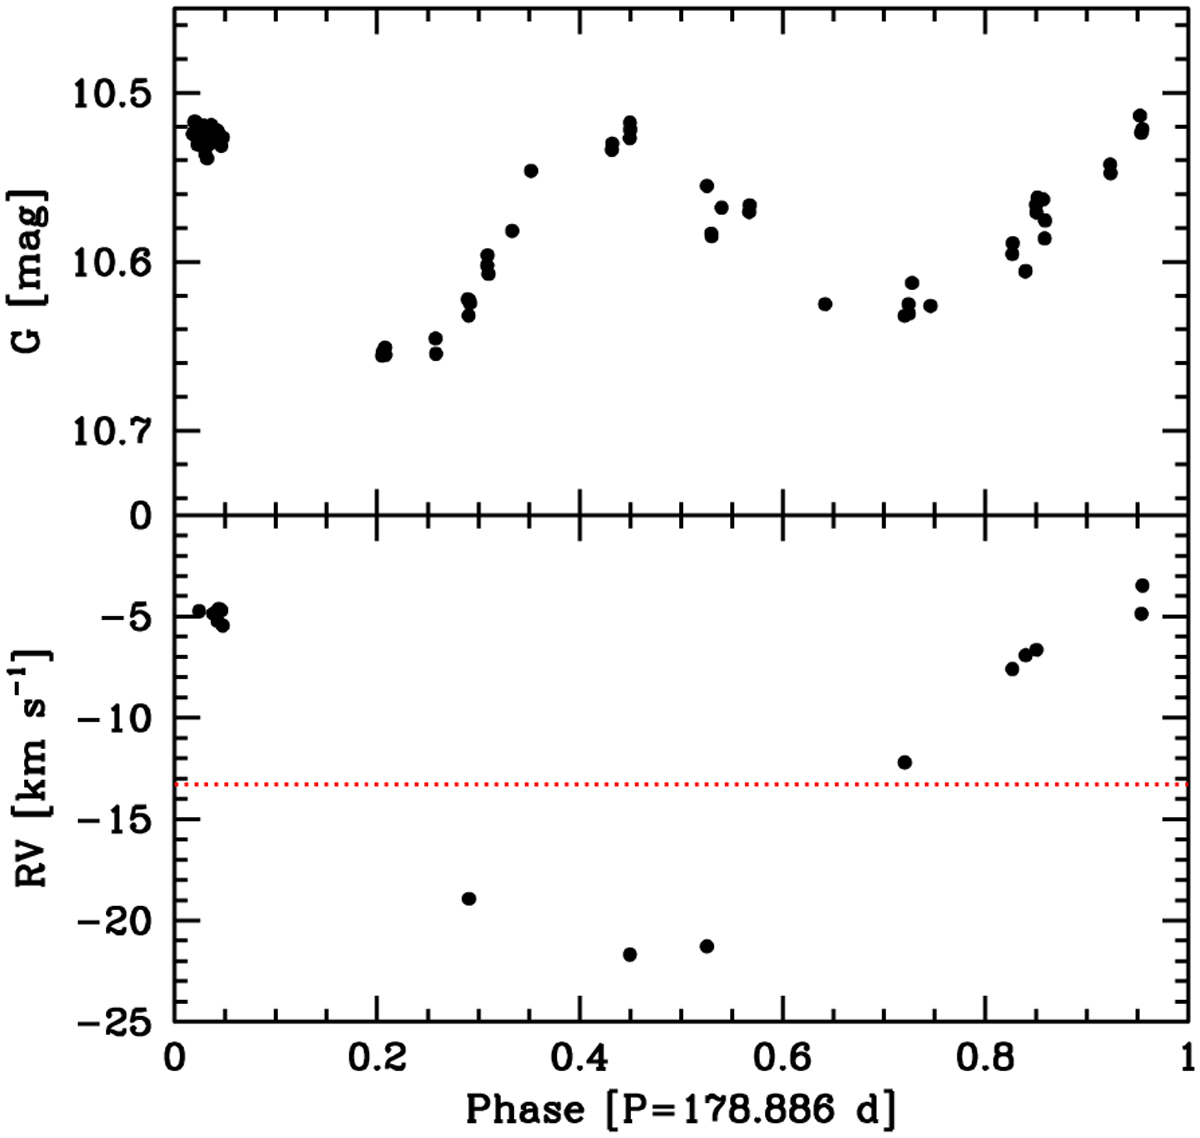
Variability of Gaia DR3 5829160851462523008. Upper panel: G lightcurve of this object plotted as a function of the phase. Lower panel: RV curve of the same object. The red dotted line represents the systemic velocity. The zero of phase is arbitrary and has been chosen to improve the readability of the graph. Error bars are not given since they have sizes of the order of the symbols.
Current usage metrics show cumulative count of Article Views (full-text article views including HTML views, PDF and ePub downloads, according to the available data) and Abstracts Views on Vision4Press platform.
Data correspond to usage on the plateform after 2015. The current usage metrics is available 48-96 hours after online publication and is updated daily on week days.
Initial download of the metrics may take a while.