Fig. 45
Download original image
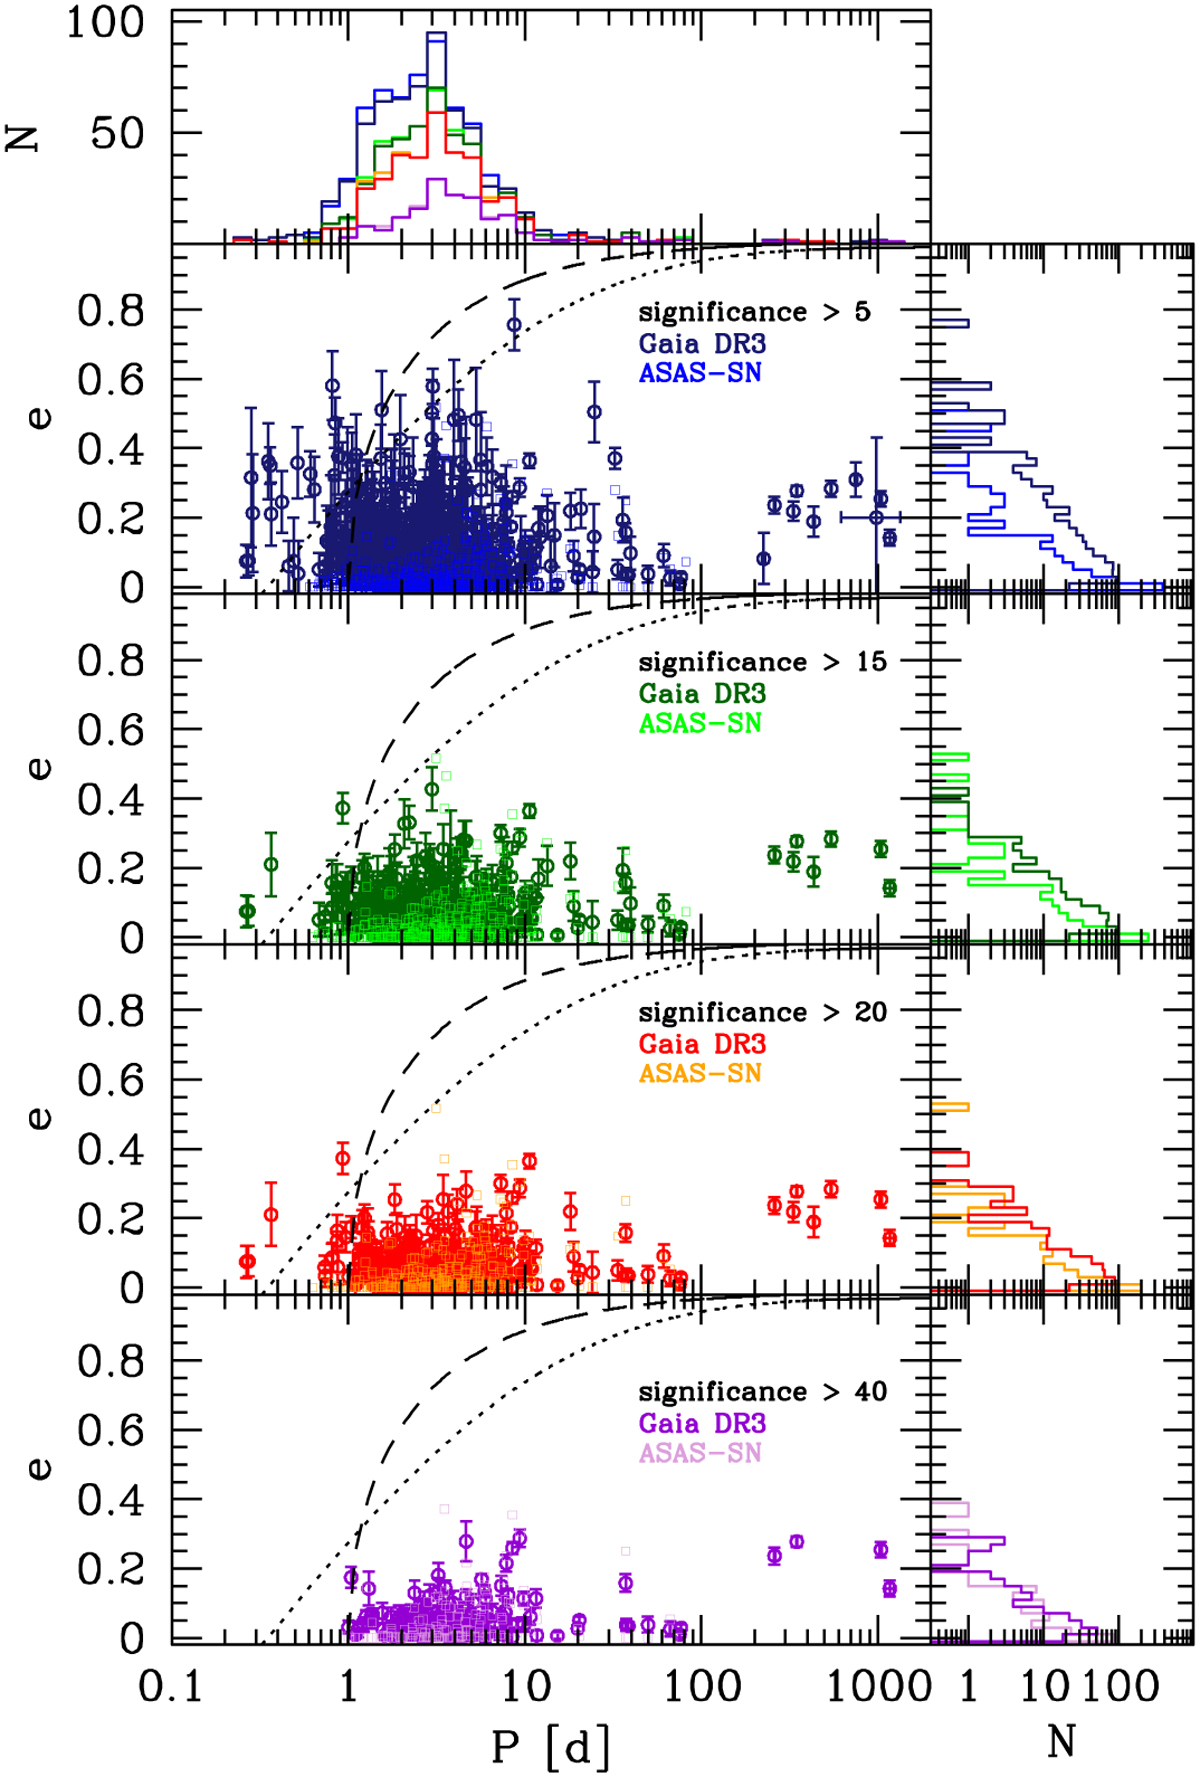
e-log P diagrams for the 626 systems in common between DR3 and ASAS-SN. Each panel corresponds to a different threshold on the solution significance. The dotted and dashed lines show the upper envelopes defined by Mazeh (2008) and Halbwachs et al. (2005), respectively. A cut-off period of one day was adopted for the latter. The position of the curve is only illustrative as this choice is somewhat arbitrary.
Current usage metrics show cumulative count of Article Views (full-text article views including HTML views, PDF and ePub downloads, according to the available data) and Abstracts Views on Vision4Press platform.
Data correspond to usage on the plateform after 2015. The current usage metrics is available 48-96 hours after online publication and is updated daily on week days.
Initial download of the metrics may take a while.