Open Access
Fig. 31
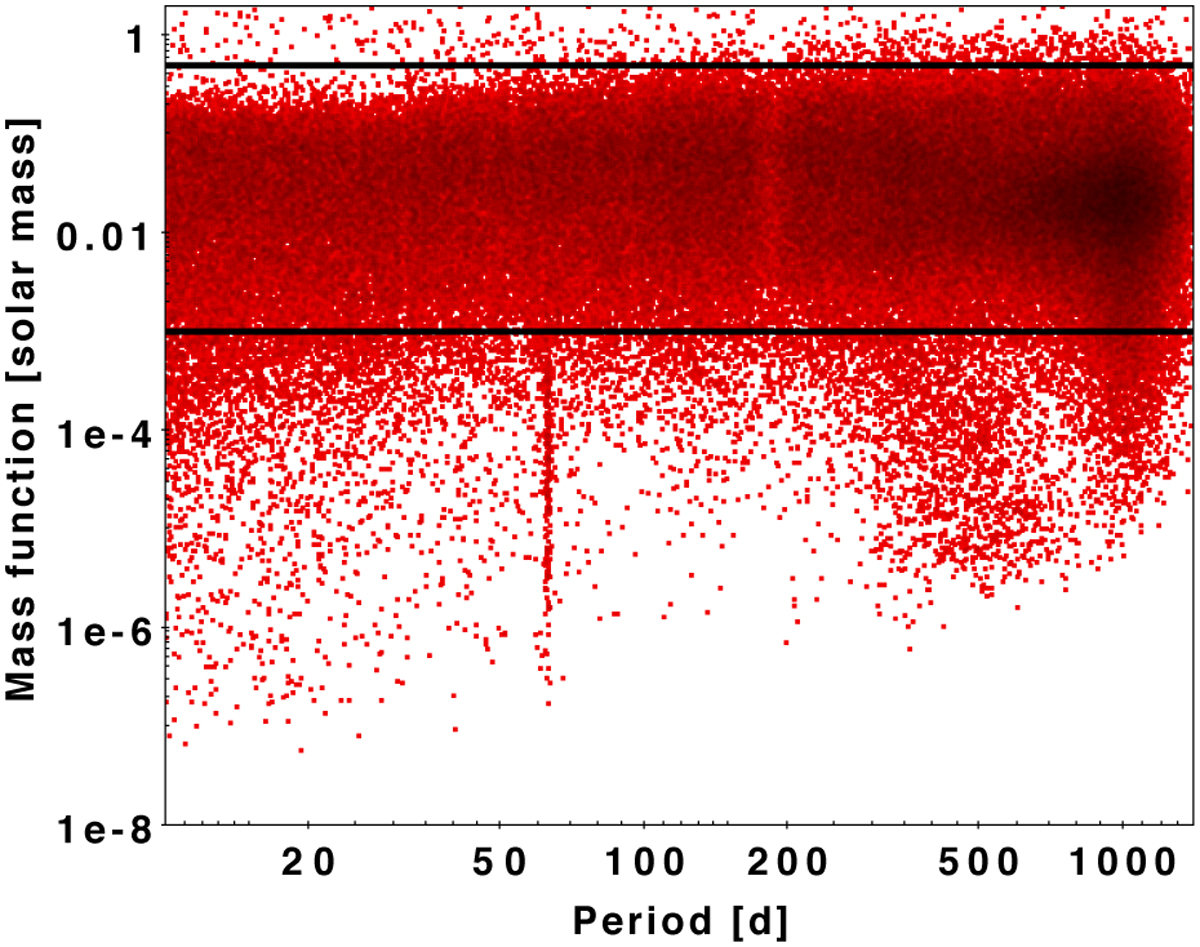
Download original image
Distribution of the observed SB1 mass function (M⊙ in log scale) as a function of the period (days in log scale). Guiding black lines are given and correspond to 0.5 M⊙ and 0.001 M⊙. Clearly the majority of the objects is in-between the two lines, the maximum populated area is just half-way (in log) between the two lines.
Current usage metrics show cumulative count of Article Views (full-text article views including HTML views, PDF and ePub downloads, according to the available data) and Abstracts Views on Vision4Press platform.
Data correspond to usage on the plateform after 2015. The current usage metrics is available 48-96 hours after online publication and is updated daily on week days.
Initial download of the metrics may take a while.