Open Access
Fig. 30
Download original image
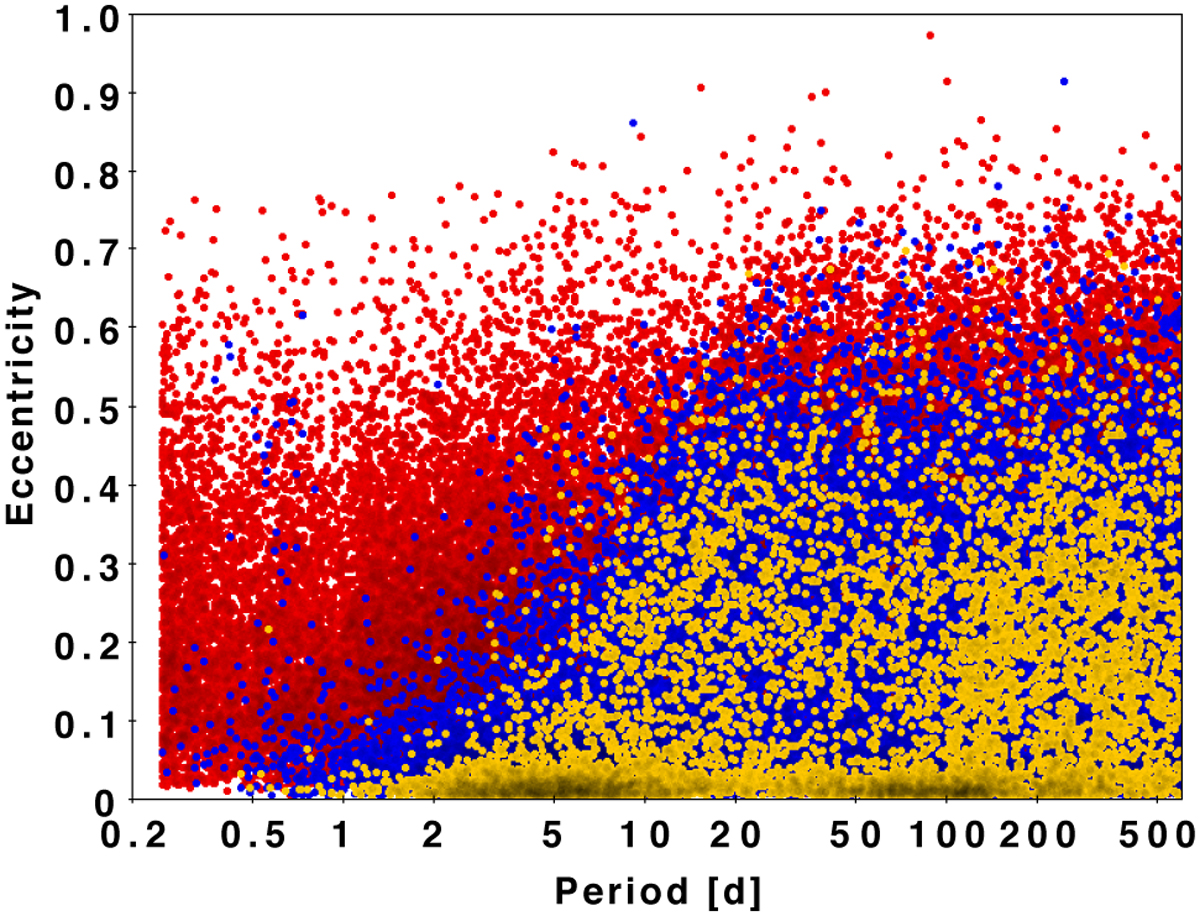
Eccentricity as a function of the period. The red points correspond to the full sample (significance larger than 5). The blue (respectively orange) points correspond to a significance larger than 30 (respectively 80). The blue points already reveal the likely circularisa- tion phenomenon that is expected to be present.
Current usage metrics show cumulative count of Article Views (full-text article views including HTML views, PDF and ePub downloads, according to the available data) and Abstracts Views on Vision4Press platform.
Data correspond to usage on the plateform after 2015. The current usage metrics is available 48-96 hours after online publication and is updated daily on week days.
Initial download of the metrics may take a while.