Fig. 3
Download original image
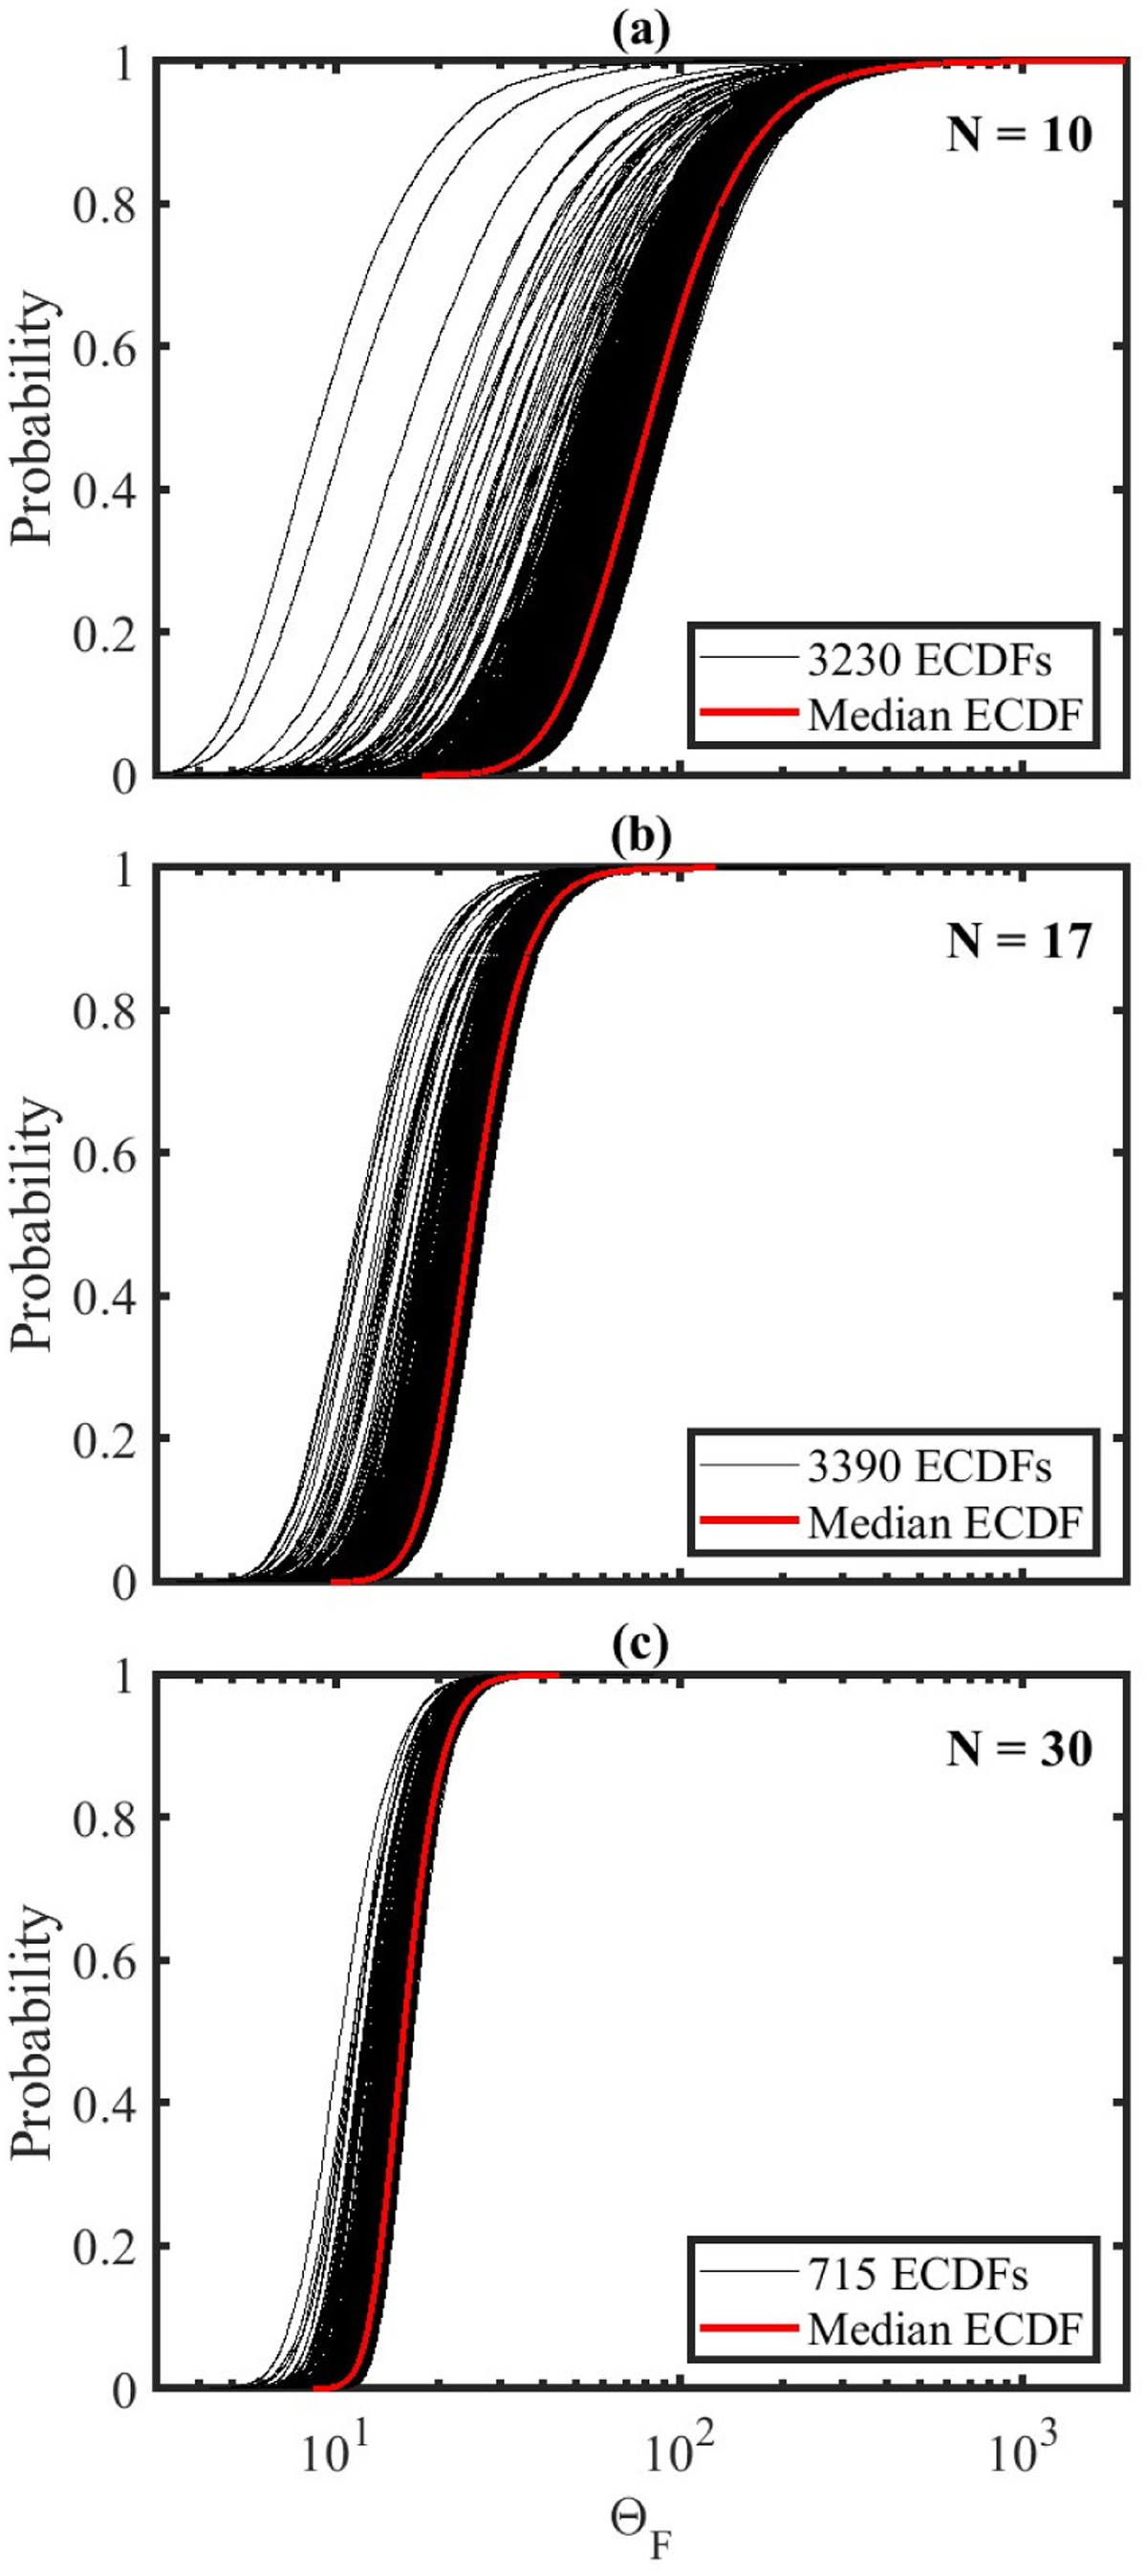
Examples of simulated ECDFs (in black) for different valid numbers of transits N and their median (in red). The ordinate gives the probability to reject the null-hypothesis of white-noise as a function of the height of the peak (ΘF statistic of Eq. (9)). Panels a, b and c correspond to N = 10, 17 and 30 respectively. The number of simulated ECDFs in each panel mirrors the proportion of valid transits in the actual data. The sampling time statistically tends to be similar for large N values, leading to a decrease in ECDF dispersion when N increases.
Current usage metrics show cumulative count of Article Views (full-text article views including HTML views, PDF and ePub downloads, according to the available data) and Abstracts Views on Vision4Press platform.
Data correspond to usage on the plateform after 2015. The current usage metrics is available 48-96 hours after online publication and is updated daily on week days.
Initial download of the metrics may take a while.