Open Access
Fig. 27
Download original image
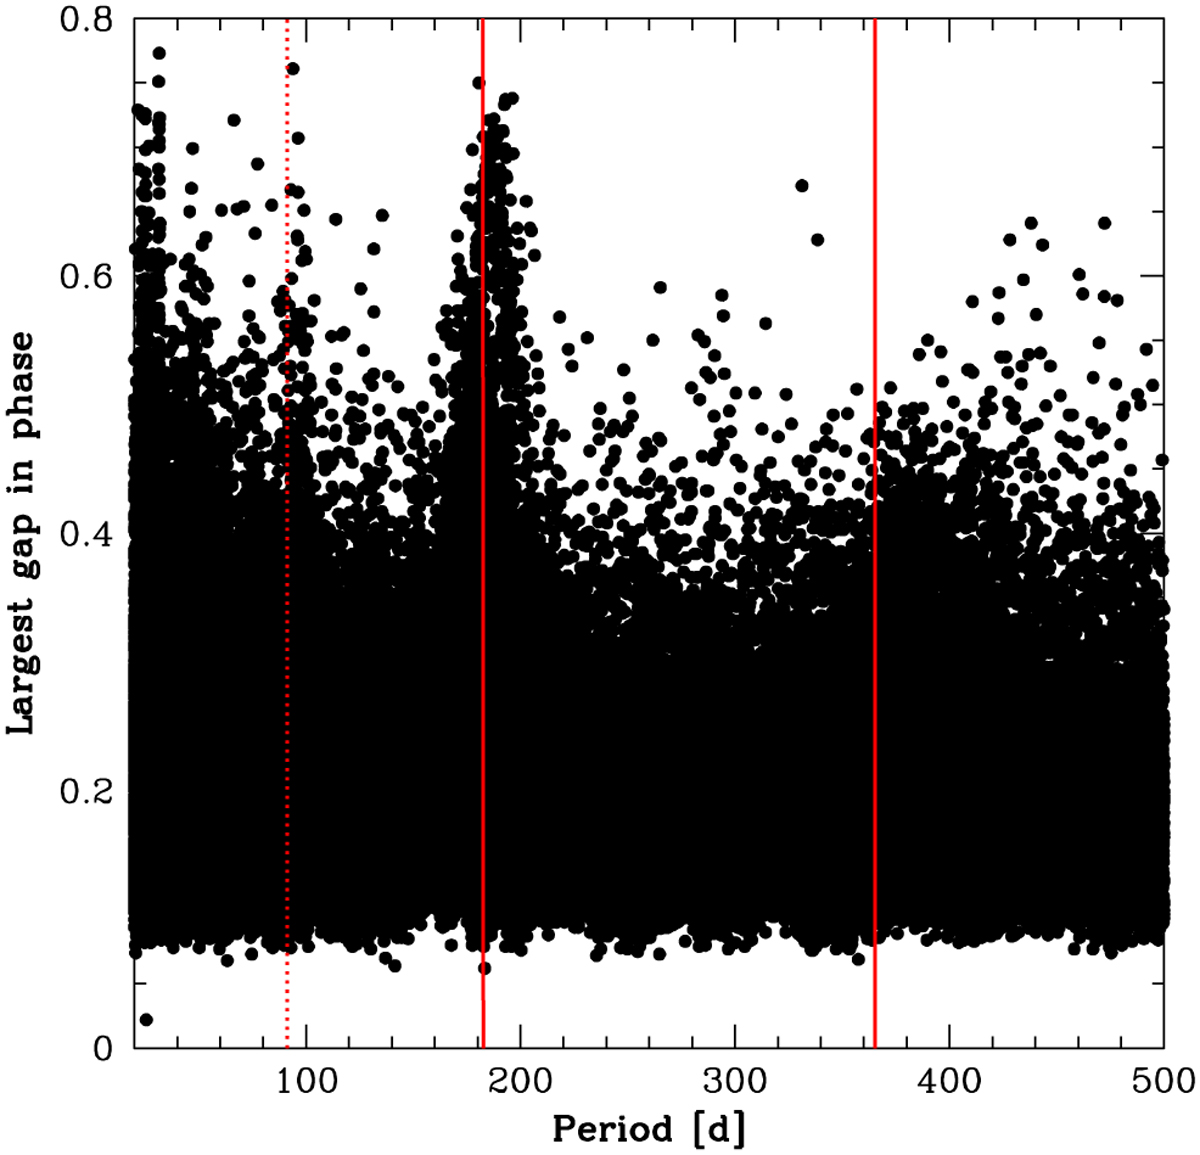
Largest gap observed in the phase diagram as a function of the period. Periods near 365.25 d and particularly 182.6 d (vertical red lines) are corresponding to the presence of some large gaps. It could also be true for the period of 91.3 d (vertical red dotted line).
Current usage metrics show cumulative count of Article Views (full-text article views including HTML views, PDF and ePub downloads, according to the available data) and Abstracts Views on Vision4Press platform.
Data correspond to usage on the plateform after 2015. The current usage metrics is available 48-96 hours after online publication and is updated daily on week days.
Initial download of the metrics may take a while.