Fig. 23
Download original image
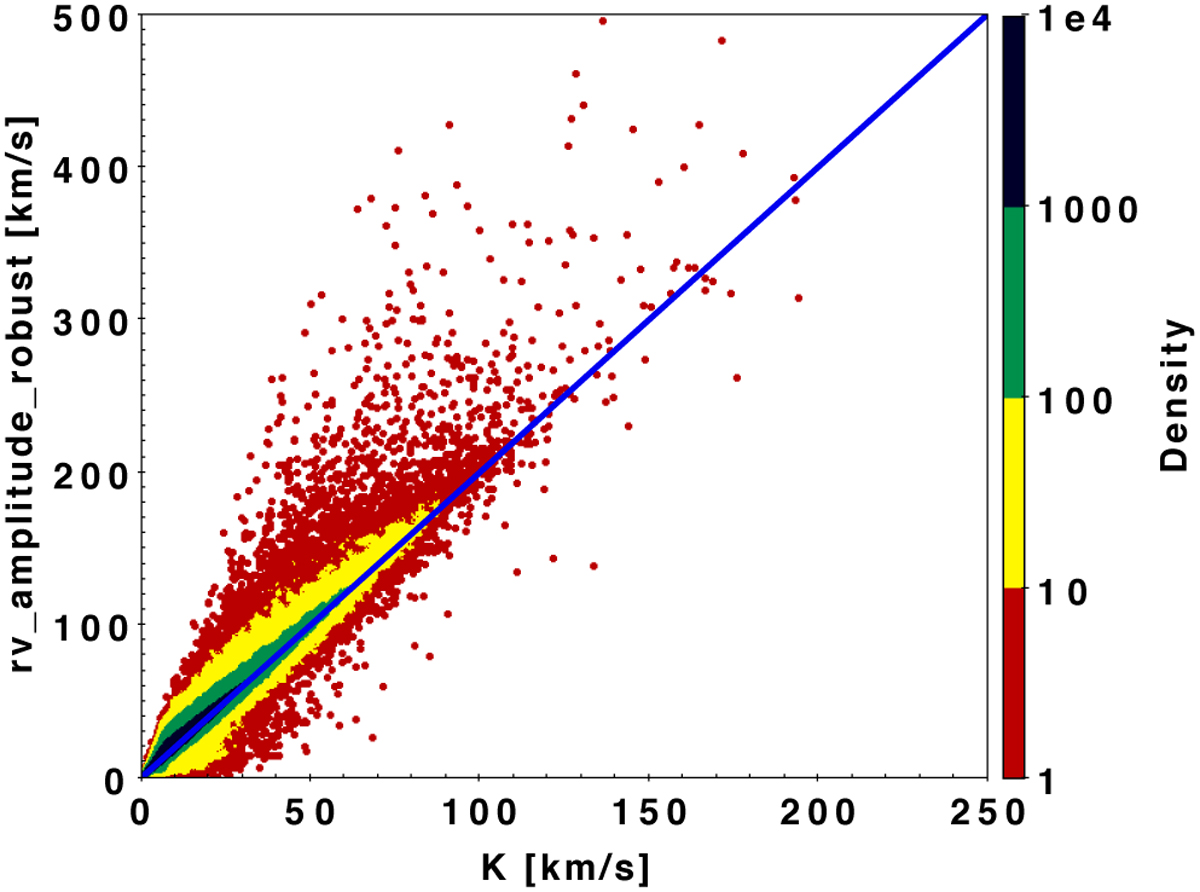
rv_amplitude_robust measured by MTA as a function of the semi-amplitude K (in km s−1). The blue line indicates the expected value (factor of 2) in absence of noise. Due to the large amount of objects (183 434), we preferred to adopt a colour-code scale that underlines the high density of solutions close to this blue line (see on the right).
Current usage metrics show cumulative count of Article Views (full-text article views including HTML views, PDF and ePub downloads, according to the available data) and Abstracts Views on Vision4Press platform.
Data correspond to usage on the plateform after 2015. The current usage metrics is available 48-96 hours after online publication and is updated daily on week days.
Initial download of the metrics may take a while.