Open Access
Fig. 21
Download original image
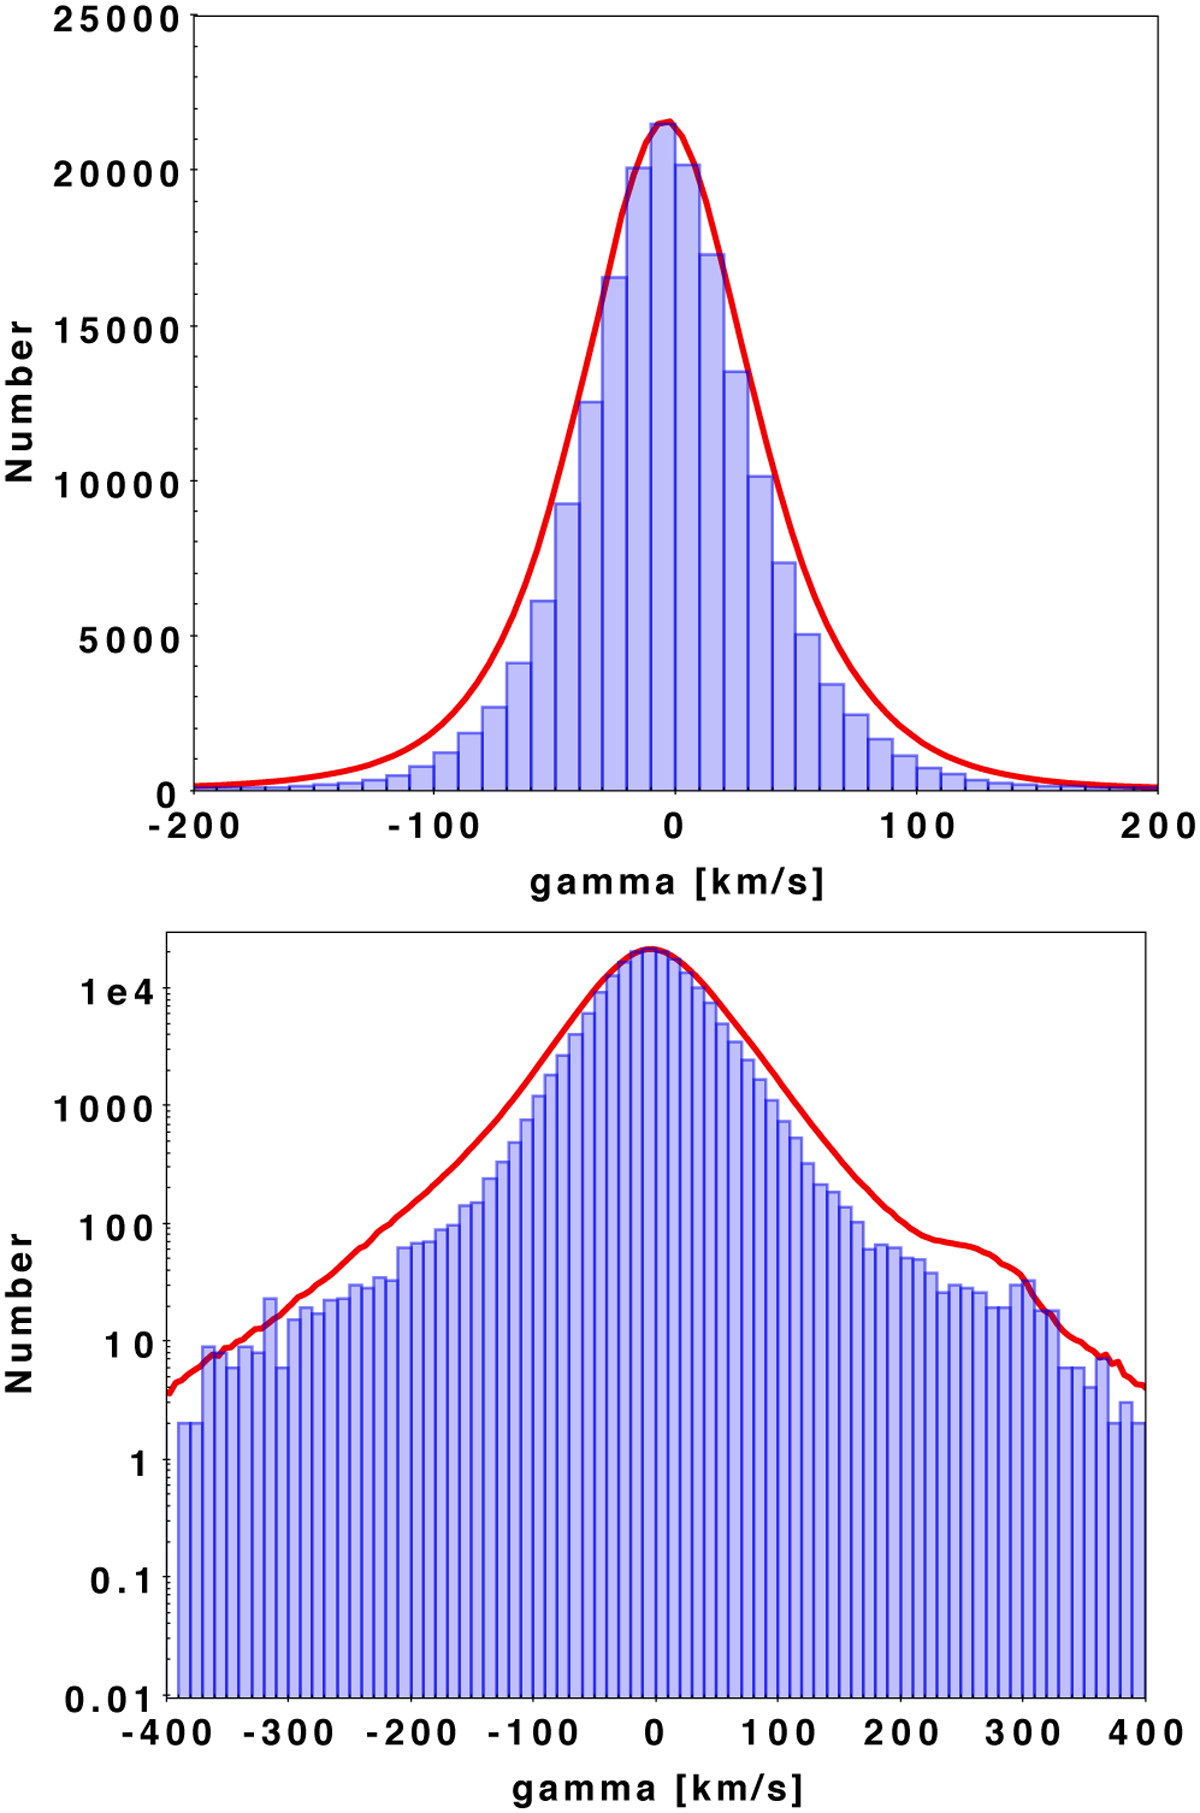
Histogram (above) and histogram in log (below) of the RVs of the centre of mass γ for all the SB 1 objects. The bin width is 10 km s−1. The red curves represent the distribution observed for the RVs of the assumed constant stars (Katz et al. 2023). These red curves have been normalised to the maximum of the histogram.
Current usage metrics show cumulative count of Article Views (full-text article views including HTML views, PDF and ePub downloads, according to the available data) and Abstracts Views on Vision4Press platform.
Data correspond to usage on the plateform after 2015. The current usage metrics is available 48-96 hours after online publication and is updated daily on week days.
Initial download of the metrics may take a while.