Fig. 20
Download original image
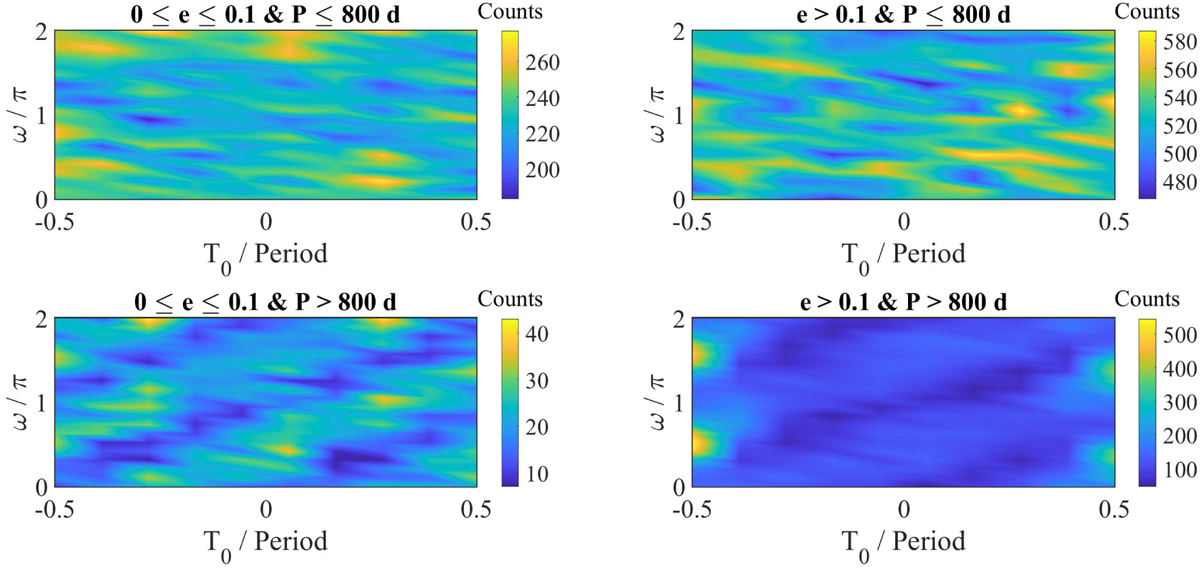
Graph of the distribution of the density of solutions as a function of two parameters for various ranges in eccentricity and period. The abscissae denote T0 normalised by the period whereas the ordinate denotes the value of ω over π. The four panels correspond to eccentricities below and above 0.1 (left and right, respectively) and periods below and above 800 d (up and bottom, respectively).
Current usage metrics show cumulative count of Article Views (full-text article views including HTML views, PDF and ePub downloads, according to the available data) and Abstracts Views on Vision4Press platform.
Data correspond to usage on the plateform after 2015. The current usage metrics is available 48-96 hours after online publication and is updated daily on week days.
Initial download of the metrics may take a while.