Open Access
Fig. 2
Download original image
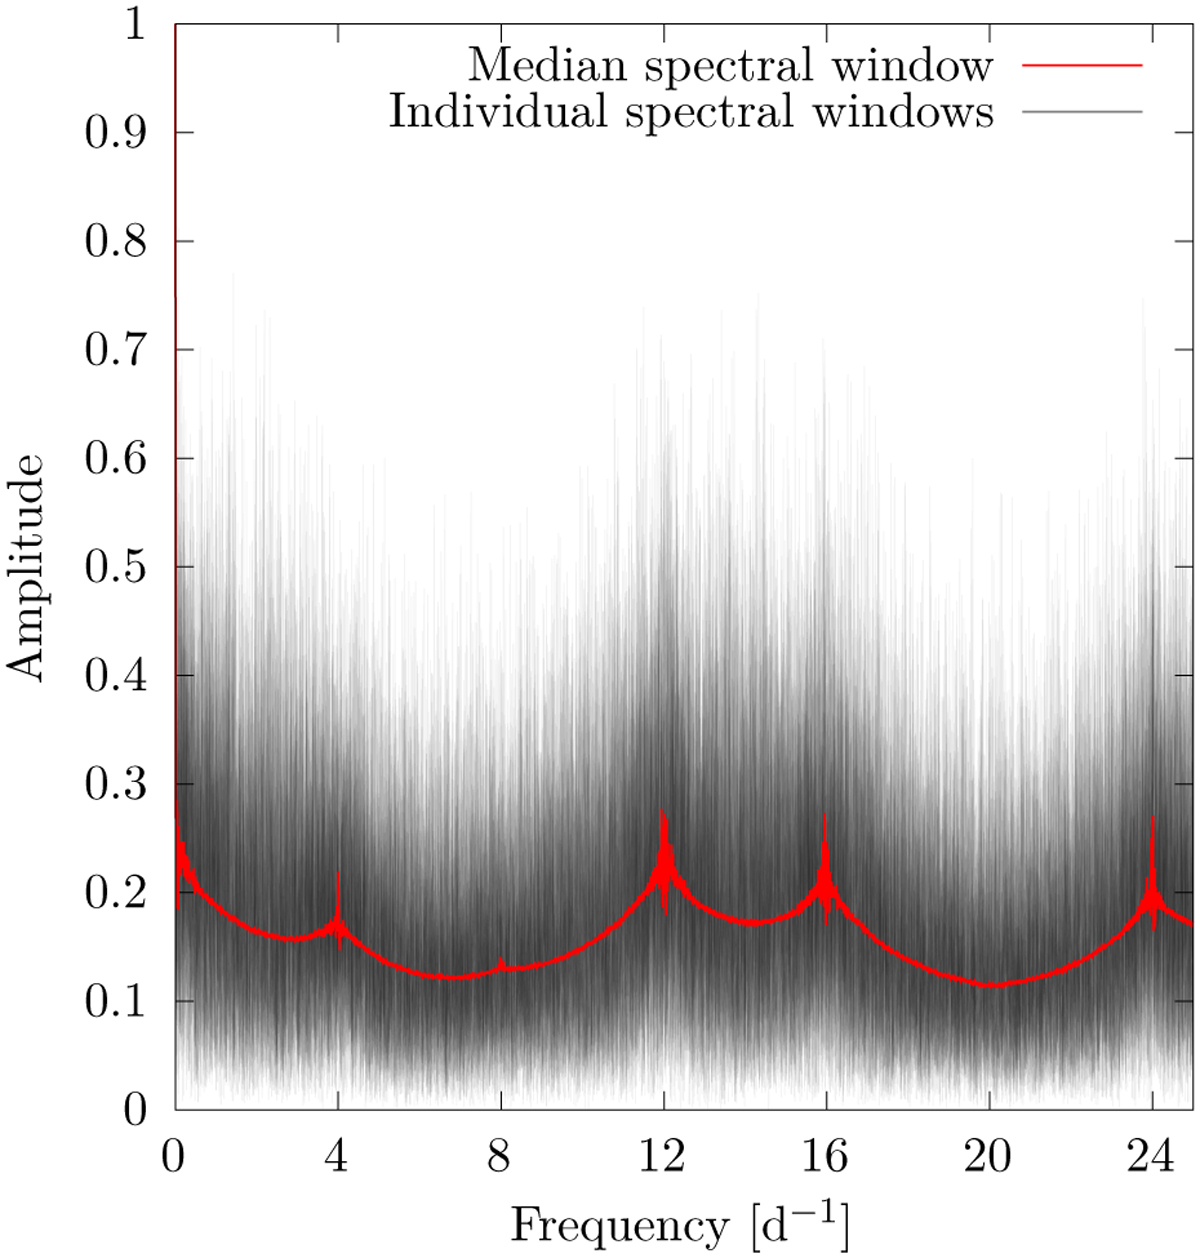
Median of the simulated amplitude spectral windows (in red). In black are shown some 32 of the individual realisations in order to illustrate the marked dispersion among the population of simulated spectral windows. By definition, all the peaks at ν = 0 d−1 are here also going up to 1.
Current usage metrics show cumulative count of Article Views (full-text article views including HTML views, PDF and ePub downloads, according to the available data) and Abstracts Views on Vision4Press platform.
Data correspond to usage on the plateform after 2015. The current usage metrics is available 48-96 hours after online publication and is updated daily on week days.
Initial download of the metrics may take a while.