Fig. 16
Download original image
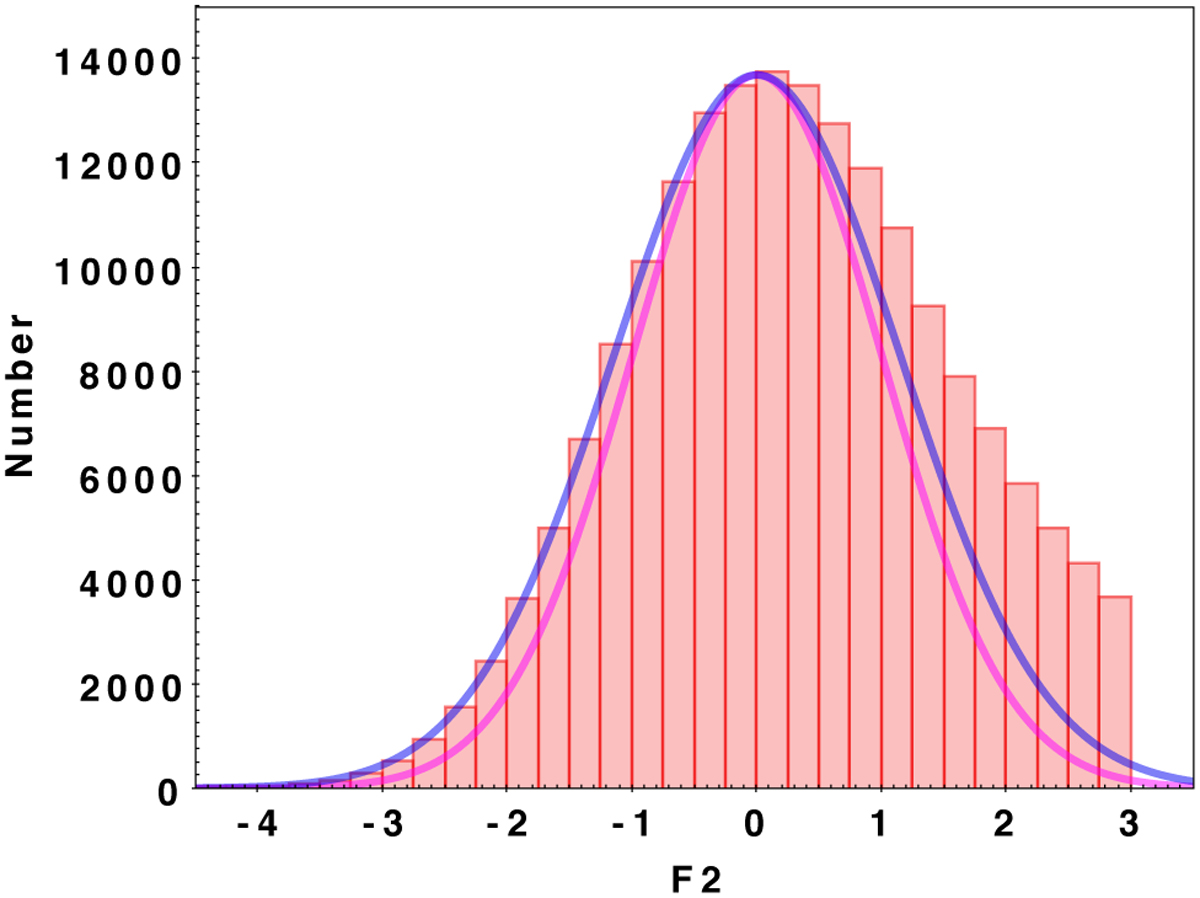
Histogram of the distribution of the F2 statistic of the different fits that are adopted as good ones. The bin width is taken to be 0.25. The cut-off at F2 =3 corresponds to the adopted threshold. The magenta curve is a Gaussian function corresponding to a zero mean and a dispersion σ= 1. This is the expected behaviour of the F2 statistic. The blue curve represents a Gaussian with σ = 1.15. This latter function follows rather well the slope of the F2 histogram on the left side. Broadly speaking, the F2 function is behaving as expected except for this larger dispersion. Both Gaussian curves were adjusted on the maximum of the histogram and are consequently not normalised on their area. They are drawn to illustrate the explanation in the text.
Current usage metrics show cumulative count of Article Views (full-text article views including HTML views, PDF and ePub downloads, according to the available data) and Abstracts Views on Vision4Press platform.
Data correspond to usage on the plateform after 2015. The current usage metrics is available 48-96 hours after online publication and is updated daily on week days.
Initial download of the metrics may take a while.