Open Access
Fig. 14
Download original image
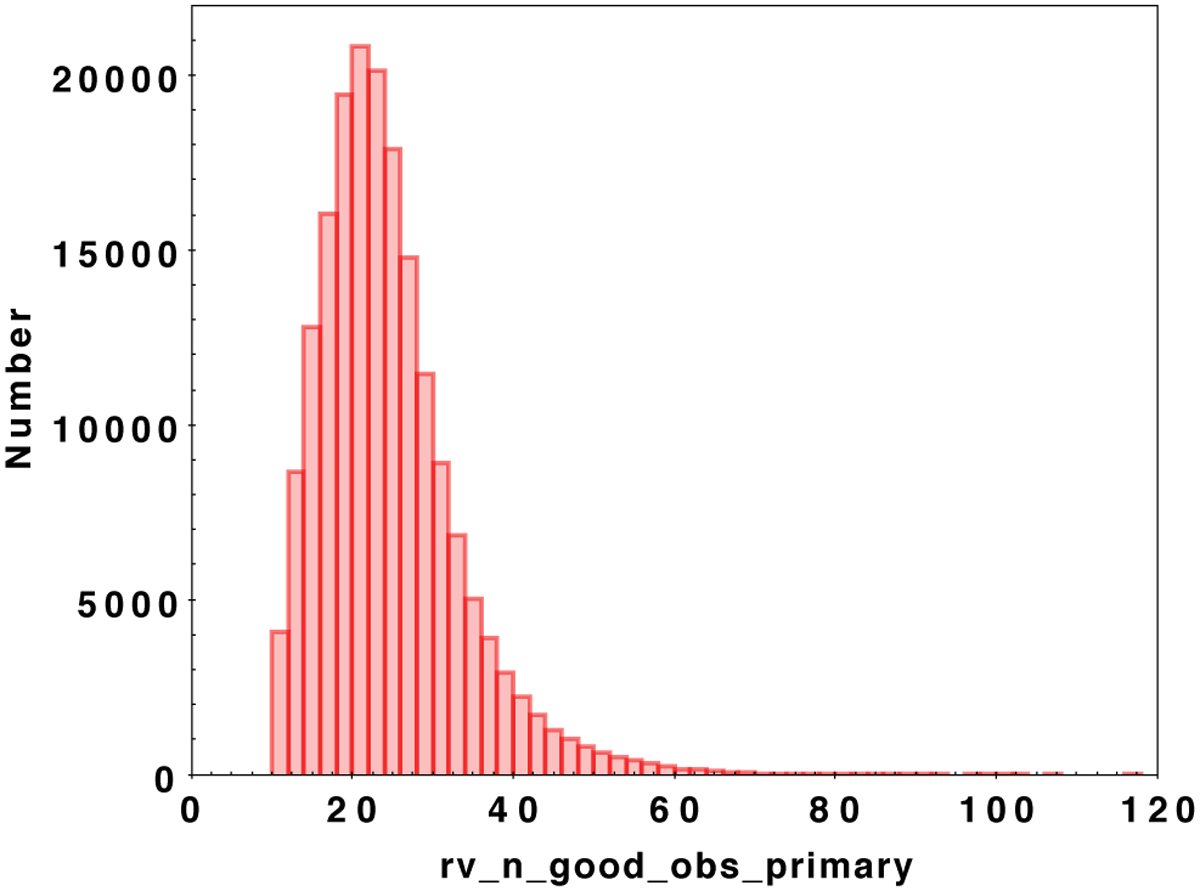
Histogram of the distribution of the number of good transits (rv_n_ցood_obs_primary ≡ Ngood) associated to the different objects with SB1-type solutions processed by the pipeline. The typical number of data points is slightly larger than 20. The bin width is 2 transits.
Current usage metrics show cumulative count of Article Views (full-text article views including HTML views, PDF and ePub downloads, according to the available data) and Abstracts Views on Vision4Press platform.
Data correspond to usage on the plateform after 2015. The current usage metrics is available 48-96 hours after online publication and is updated daily on week days.
Initial download of the metrics may take a while.