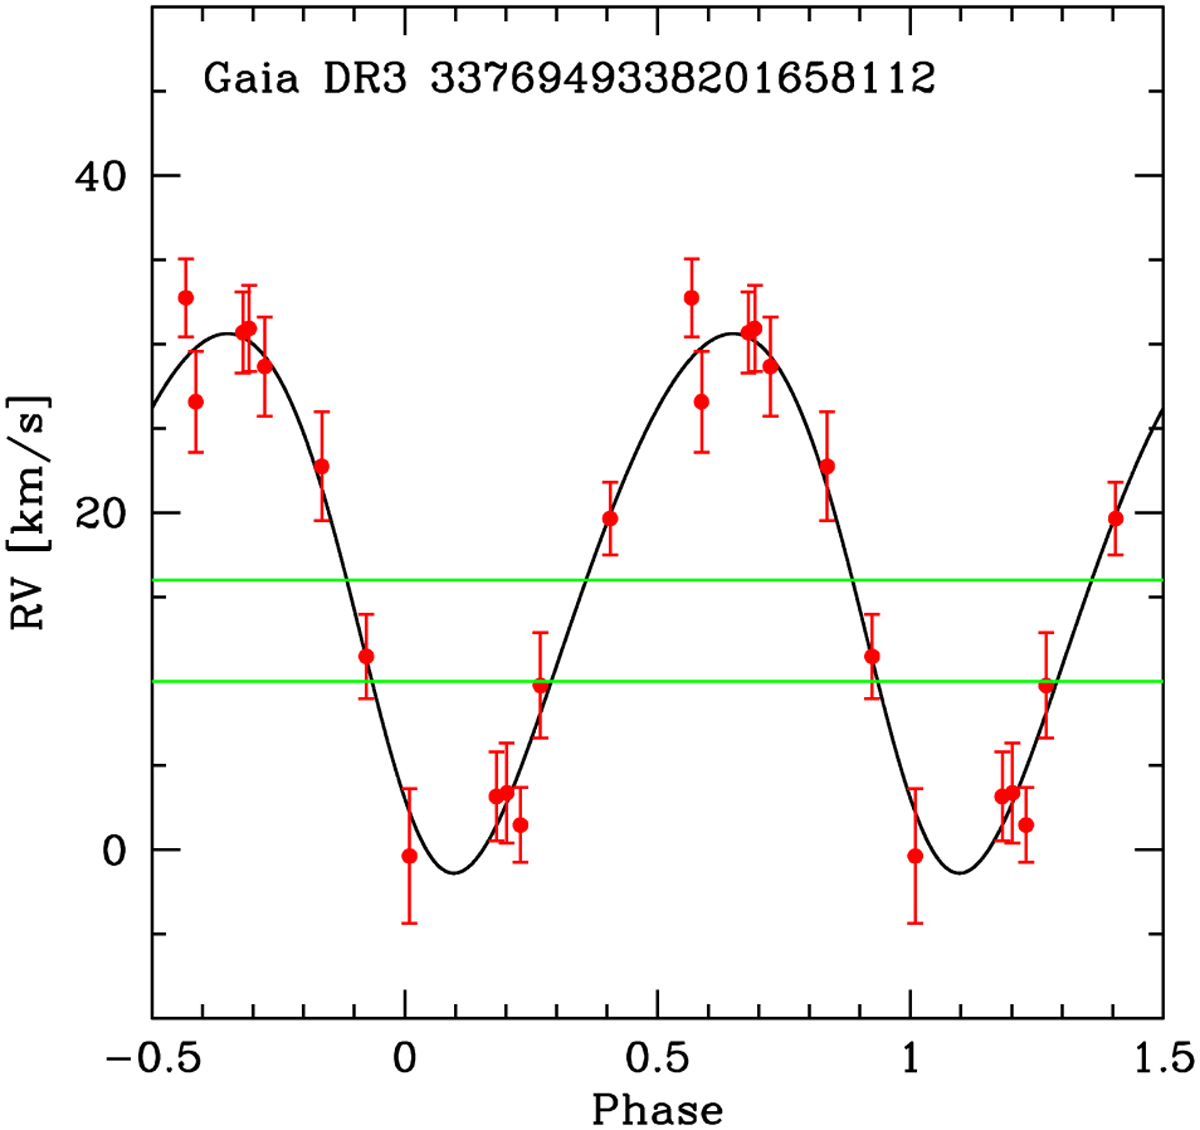
Fig. 12
Download original image
Folded RV curve for the star Gaia DR3 3376949338201658112 corresponding to the selected period of 0.657582 d. The observed RVs and their error bars are plotted in red along with in black the fitted RV curve. The green lines delimit the domain where the ground-based RVs part of the LAMOST survey are distributed. See also the Figure A.3 of Bashi et al. (2022).
Current usage metrics show cumulative count of Article Views (full-text article views including HTML views, PDF and ePub downloads, according to the available data) and Abstracts Views on Vision4Press platform.
Data correspond to usage on the plateform after 2015. The current usage metrics is available 48-96 hours after online publication and is updated daily on week days.
Initial download of the metrics may take a while.