Fig. 1
Download original image
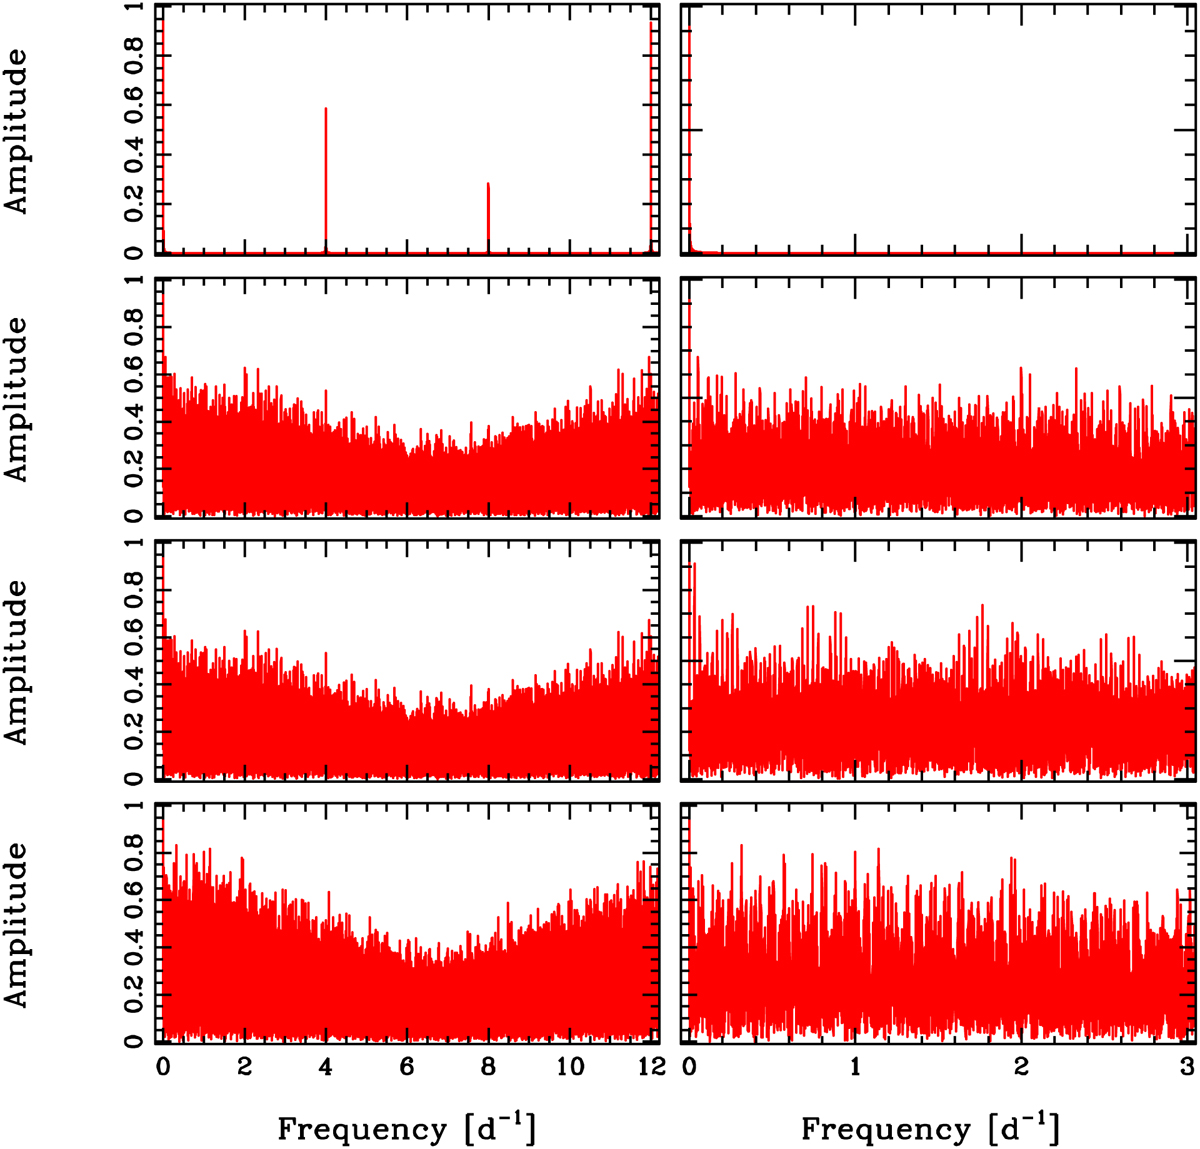
Amplitude spectral window corresponding to various sampling. By definition, the peak at ν = 0 d−1 is always going up to the value 1. The upper panel corresponds to some 8000 data points and illustrates the sampling that Gaia would generate if the sole effect would correspond to the spinning of the satellite on itself. The three other panels represent typical spectral windows corresponding to objects at various positions in the sky. The number of data points are, from the second panel to the bottom one, respectively, 26, 19 and 14. The right panels are zooming on the low frequency domain. All the individual peaks have by definition the same shape and the same width. They are not resolved in this figure.
Current usage metrics show cumulative count of Article Views (full-text article views including HTML views, PDF and ePub downloads, according to the available data) and Abstracts Views on Vision4Press platform.
Data correspond to usage on the plateform after 2015. The current usage metrics is available 48-96 hours after online publication and is updated daily on week days.
Initial download of the metrics may take a while.