Open Access
Fig. 9
Download original image
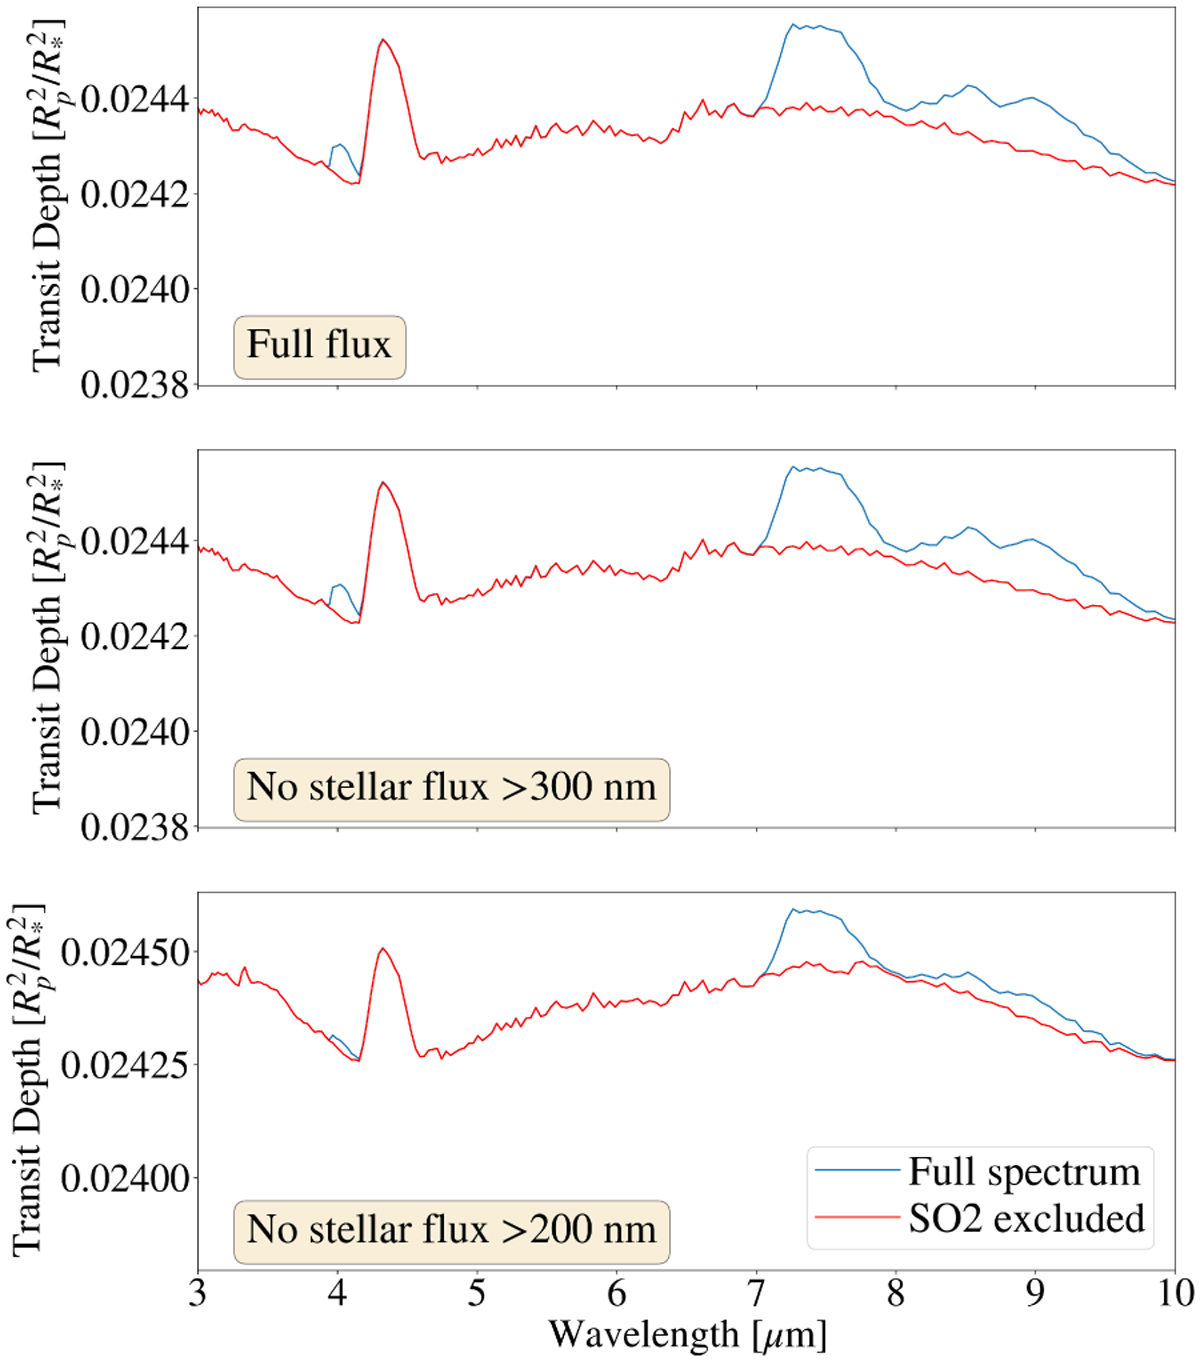
Transit spectrum of our fiducial model (top panel), and the same model but with all flux removed above 300 nm (middle panel) and all flux removed above 200 nm (bottom panel). This figure shows the contribution of the flux between 200 and 300 nm and the contribution of flux >300 nm to the transit spectrum.
Current usage metrics show cumulative count of Article Views (full-text article views including HTML views, PDF and ePub downloads, according to the available data) and Abstracts Views on Vision4Press platform.
Data correspond to usage on the plateform after 2015. The current usage metrics is available 48-96 hours after online publication and is updated daily on week days.
Initial download of the metrics may take a while.