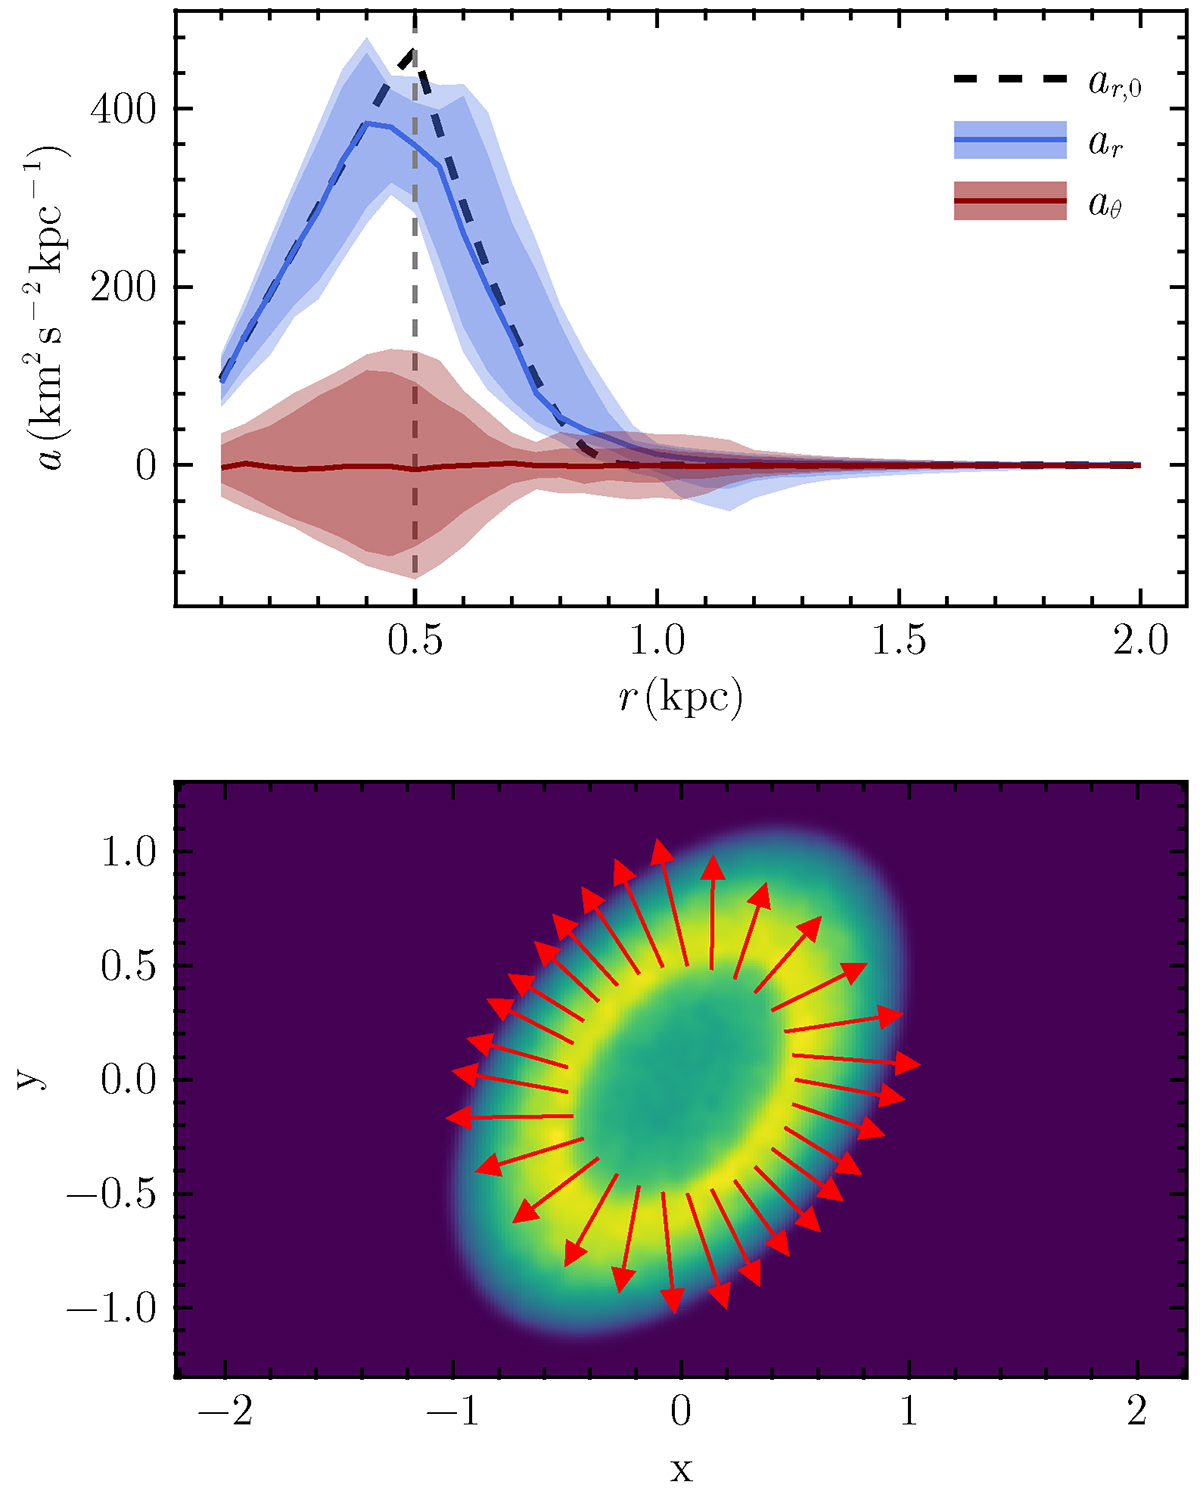
Fig. B.4.
Download original image
Acceleration field of sheared SB. The top panel shows the acceleration field components of a close-to-maximally sheared SB mass distribution compared to a non-shared distribution. The corridors describe the 65 and 95% range of the components with different directions from the centre. The dashed line shows at what radius the bottom panel is measured. In the bottom panel we depict how the acceleration field changes with direction from the centre of the SB. The tangential component and the angular dependence of acceleration field can be observed.
Current usage metrics show cumulative count of Article Views (full-text article views including HTML views, PDF and ePub downloads, according to the available data) and Abstracts Views on Vision4Press platform.
Data correspond to usage on the plateform after 2015. The current usage metrics is available 48-96 hours after online publication and is updated daily on week days.
Initial download of the metrics may take a while.