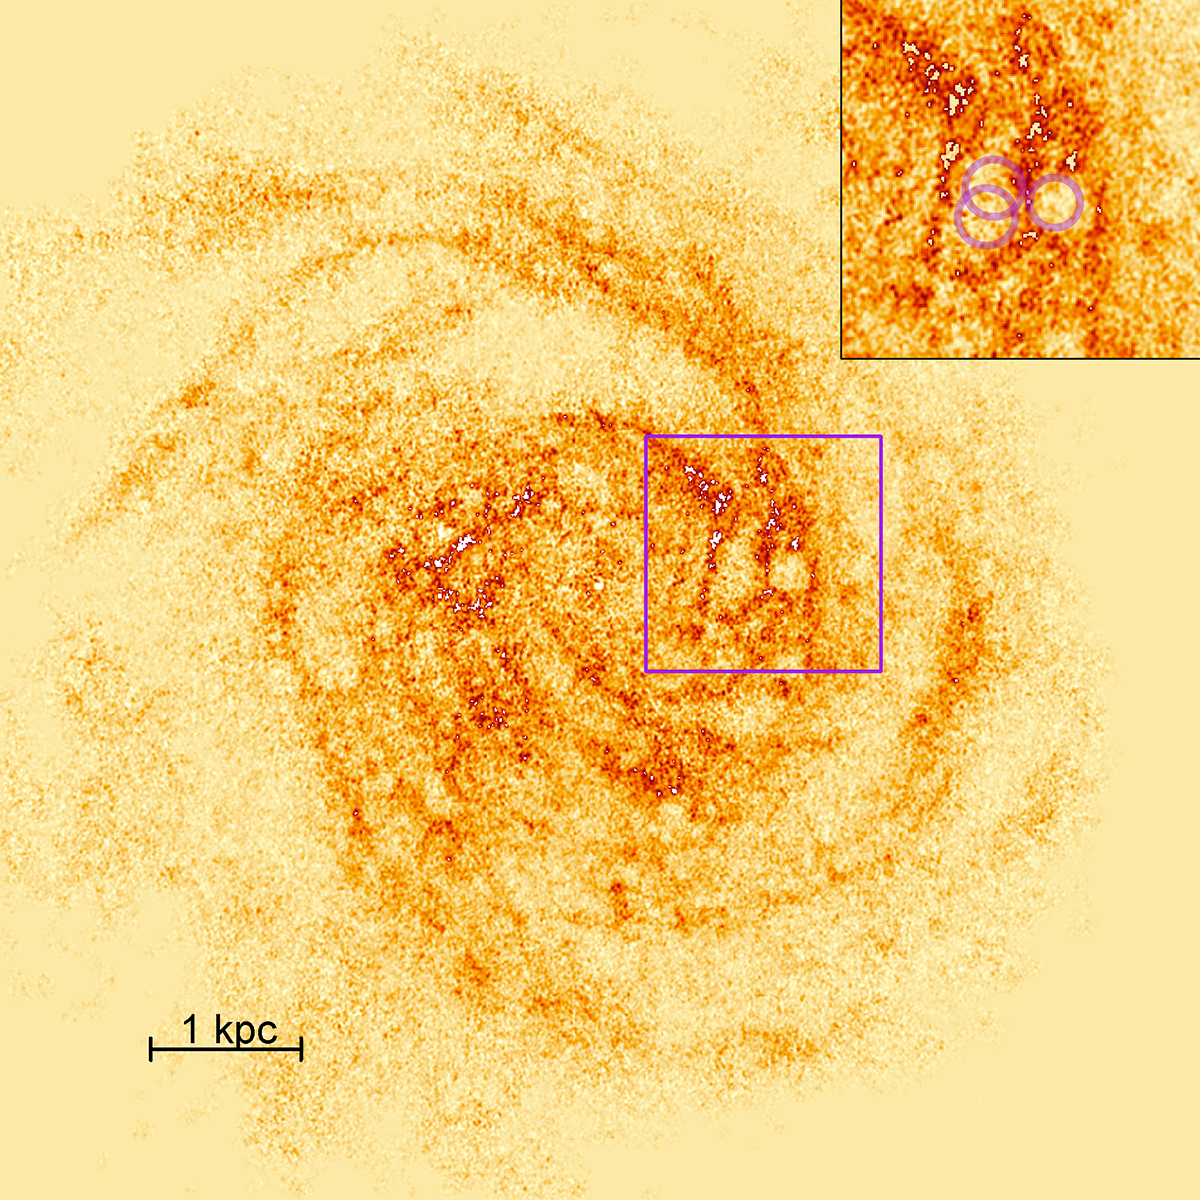
Fig. 1.
Download original image
Illustration of SBs in galaxy NGC 6946 from the intensity map of the THINGS survey (Walter et al. 2008). The inset in the top right corner is a zoomed-in image of a fraction of the galaxy where the locations of three SBs are shown (pink circles). A more detailed map of all the bubbles in the galaxy is shown in Brinks et al. (2007).
Current usage metrics show cumulative count of Article Views (full-text article views including HTML views, PDF and ePub downloads, according to the available data) and Abstracts Views on Vision4Press platform.
Data correspond to usage on the plateform after 2015. The current usage metrics is available 48-96 hours after online publication and is updated daily on week days.
Initial download of the metrics may take a while.