Open Access
Fig. 8.
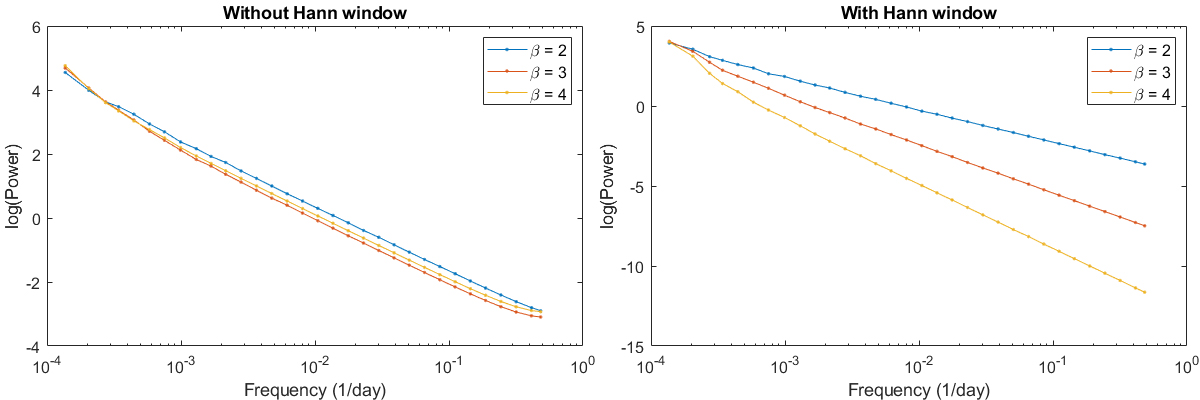
Download original image
Effect of windowing on steep slopes in periodogram analysis. The left-side plot shows examples of periodograms with varying simple power-law slopes and red-noise leak present. On the right-side plot are the equivalent power-law slopes, but this time the same time series has been convolved with the Hann window.
Current usage metrics show cumulative count of Article Views (full-text article views including HTML views, PDF and ePub downloads, according to the available data) and Abstracts Views on Vision4Press platform.
Data correspond to usage on the plateform after 2015. The current usage metrics is available 48-96 hours after online publication and is updated daily on week days.
Initial download of the metrics may take a while.