Open Access
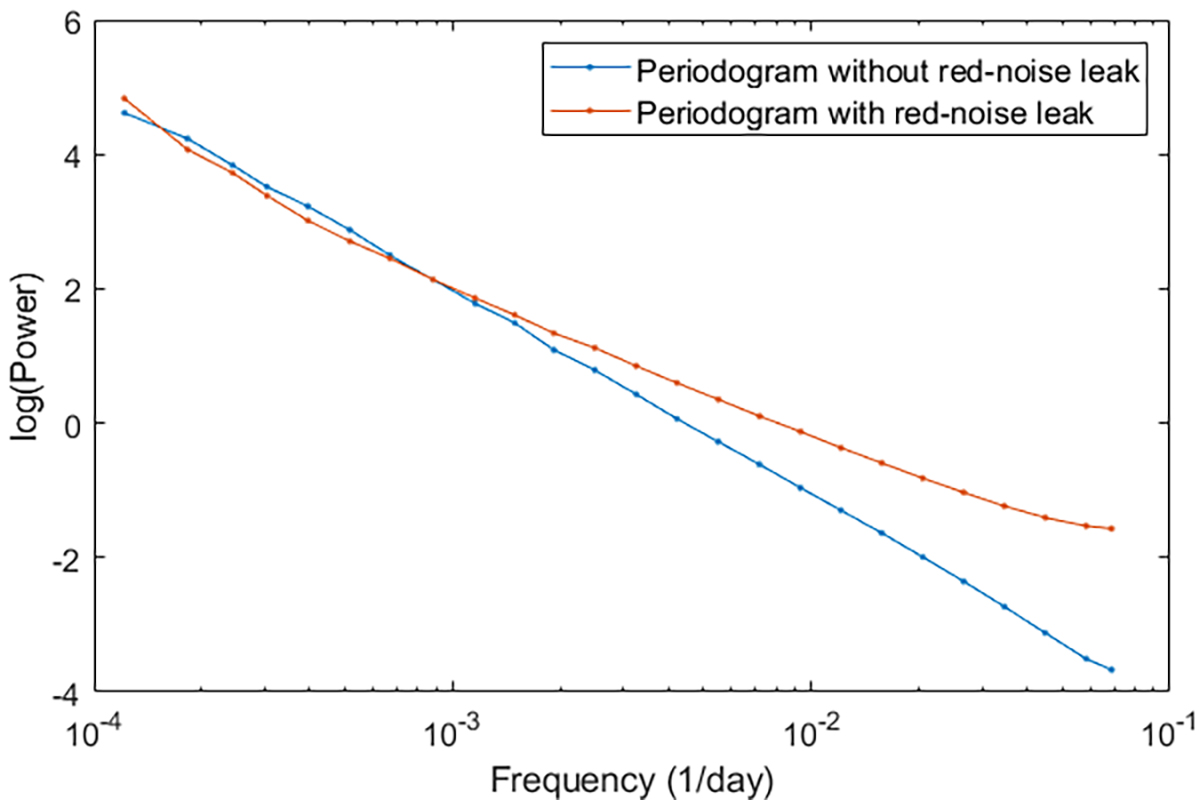
Fig. 7.
Download original image
Comparison between periodograms with no red-noise leak and with red-noise leak present. The blue periodogram is of a light curve without red-noise leak, and the orange periodogram is of a light curve with red-noise leak. Both of the light curves were simulated using the same power-law slope.
Current usage metrics show cumulative count of Article Views (full-text article views including HTML views, PDF and ePub downloads, according to the available data) and Abstracts Views on Vision4Press platform.
Data correspond to usage on the plateform after 2015. The current usage metrics is available 48-96 hours after online publication and is updated daily on week days.
Initial download of the metrics may take a while.