Fig. 6.
Download original image
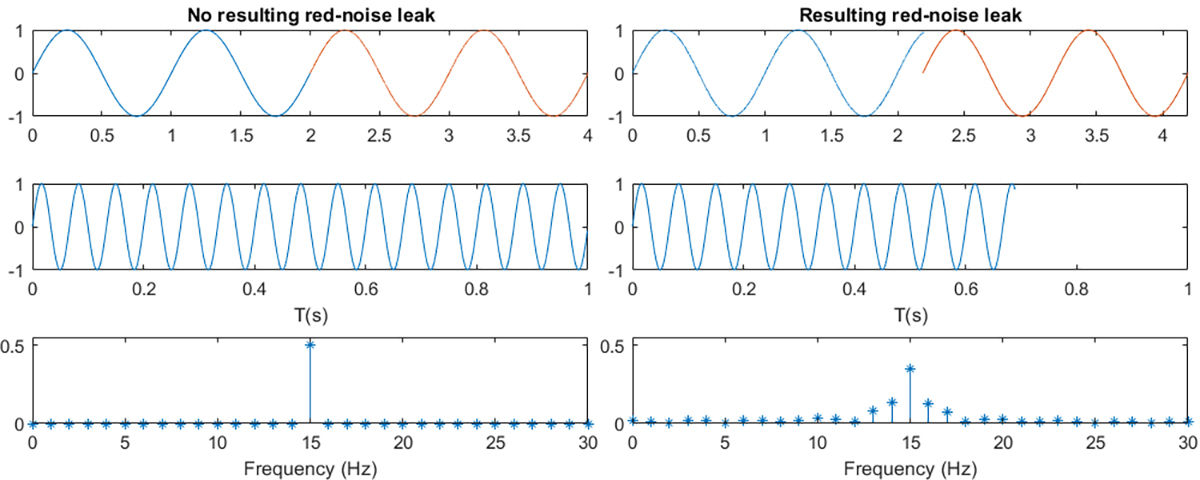
Plots illustrating the cause of red-noise leak in Fourier analysis. The top left-side plot shows a sine wave with two full periods resulting in no red-noise leak, depicted by the continuous sine wave transfer from blue to orange. The right-side plot shows a non-integer multiple of the period resulting in a discontinuity in the Fourier transform. The middle row shows sine waves with periods T = 1/(15 Hz), with the left-side plot having again full integer periods and the right-side plot conversely having a discontinuity. The bottom row shows the respective periodograms.
Current usage metrics show cumulative count of Article Views (full-text article views including HTML views, PDF and ePub downloads, according to the available data) and Abstracts Views on Vision4Press platform.
Data correspond to usage on the plateform after 2015. The current usage metrics is available 48-96 hours after online publication and is updated daily on week days.
Initial download of the metrics may take a while.