Open Access
Fig. 4.
Download original image
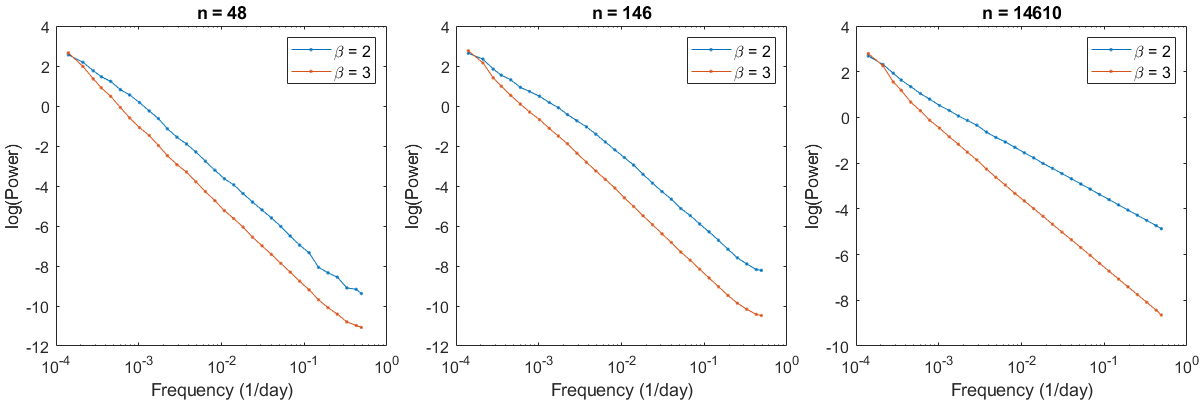
Mean periodograms plotted using simulated light curves constructed from two simple power laws with β = 2 and β = 3 with a varying number of data points. The first plot includes 48 data points, the second plot 146 data points, and the third plot is evenly sampled with the full 14 610 data points.
Current usage metrics show cumulative count of Article Views (full-text article views including HTML views, PDF and ePub downloads, according to the available data) and Abstracts Views on Vision4Press platform.
Data correspond to usage on the plateform after 2015. The current usage metrics is available 48-96 hours after online publication and is updated daily on week days.
Initial download of the metrics may take a while.