Fig. 3.
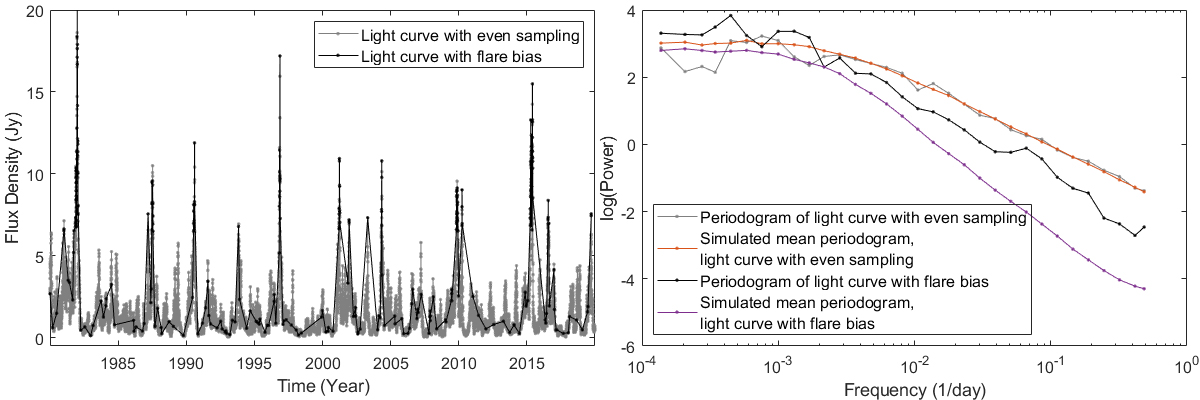
Download original image
Comparison between the PSDs of an evenly sampled light curve and flare-biased light curve. Left-side plot: Light curve we generated using the bending power-law PSD with parameters β = 2 and xb = 500. The grey light curve has been evenly sampled, and the black light curve has flare bias. Right-side plot: Obtained periodograms. The periodogram in grey shows the PSD of the light curve with even sampling. The periodogram in orange is the mean periodogram of 1000 realisations using the same parameters and even sampling. The black periodogram is the periodogram of the flare-biased light curve. The purple periodogram is the mean periodogram of 1000 realisations using the same parameters and replicated sampling. Because the replicated periods of denser sampling only randomly occur during flares in simulated light curves, the effect of interpolation is stronger than on the black periodogram.
Current usage metrics show cumulative count of Article Views (full-text article views including HTML views, PDF and ePub downloads, according to the available data) and Abstracts Views on Vision4Press platform.
Data correspond to usage on the plateform after 2015. The current usage metrics is available 48-96 hours after online publication and is updated daily on week days.
Initial download of the metrics may take a while.