Fig. 2.
Download original image
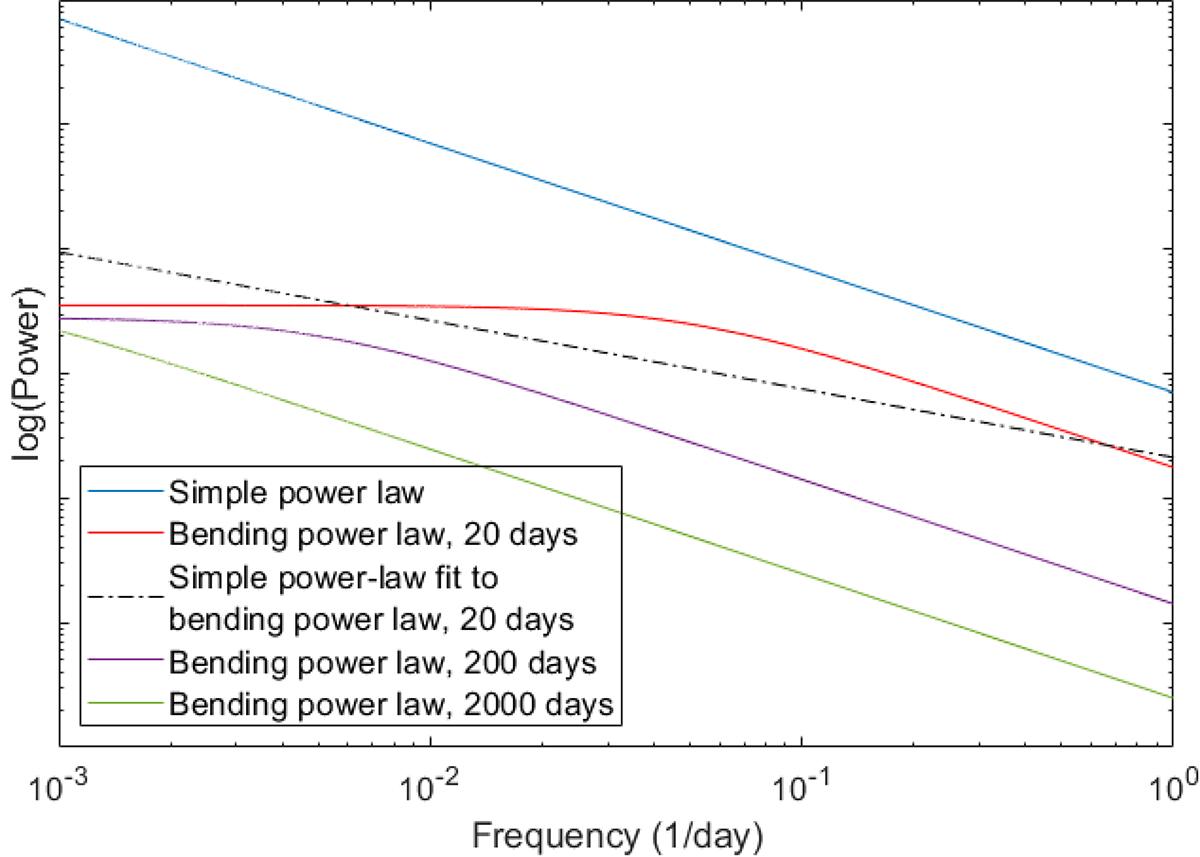
Plot showing four PSDs of varying parameters and with a slope of β = 2. In the blue is the simple power law, in red is the bending power law with a characteristic timescale of 20 days, in purple is the bending power law with a characteristic timescale of 200 days, and last in green is the bending power law with a characteristic timescale of 2000 days. The dashed grey line shows the principle of how a simple power law would fit to a bending power law. The powers (y-axis) are arbitrarily scaled.
Current usage metrics show cumulative count of Article Views (full-text article views including HTML views, PDF and ePub downloads, according to the available data) and Abstracts Views on Vision4Press platform.
Data correspond to usage on the plateform after 2015. The current usage metrics is available 48-96 hours after online publication and is updated daily on week days.
Initial download of the metrics may take a while.