Fig. 11.
Download original image
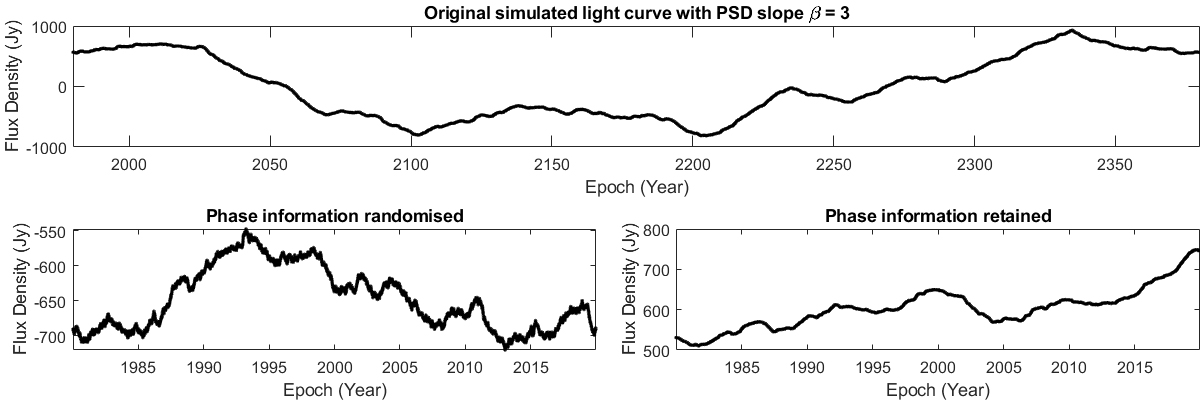
Plots illustrating how randomising the phase information affects the resulting light curve in the EMP13 algorithm. The top row is the entire simulated light curve with slope β = 3 using the TK95 algorithm. The bottom left-side plot shows the light curve obtained from a 40-year segment of the entire light curve, which has been run through the iterative step of the EMP13 algorithm. The right-side plot shows the result of the same iterative step when the entire light curve has gone through it, and only after the iterations has it been cut to a 40-year segment. The PDF used for the EMP13 algorithm was Gaussian with a mean of zero and a standard deviation of one.
Current usage metrics show cumulative count of Article Views (full-text article views including HTML views, PDF and ePub downloads, according to the available data) and Abstracts Views on Vision4Press platform.
Data correspond to usage on the plateform after 2015. The current usage metrics is available 48-96 hours after online publication and is updated daily on week days.
Initial download of the metrics may take a while.