Fig. 8
Download original image
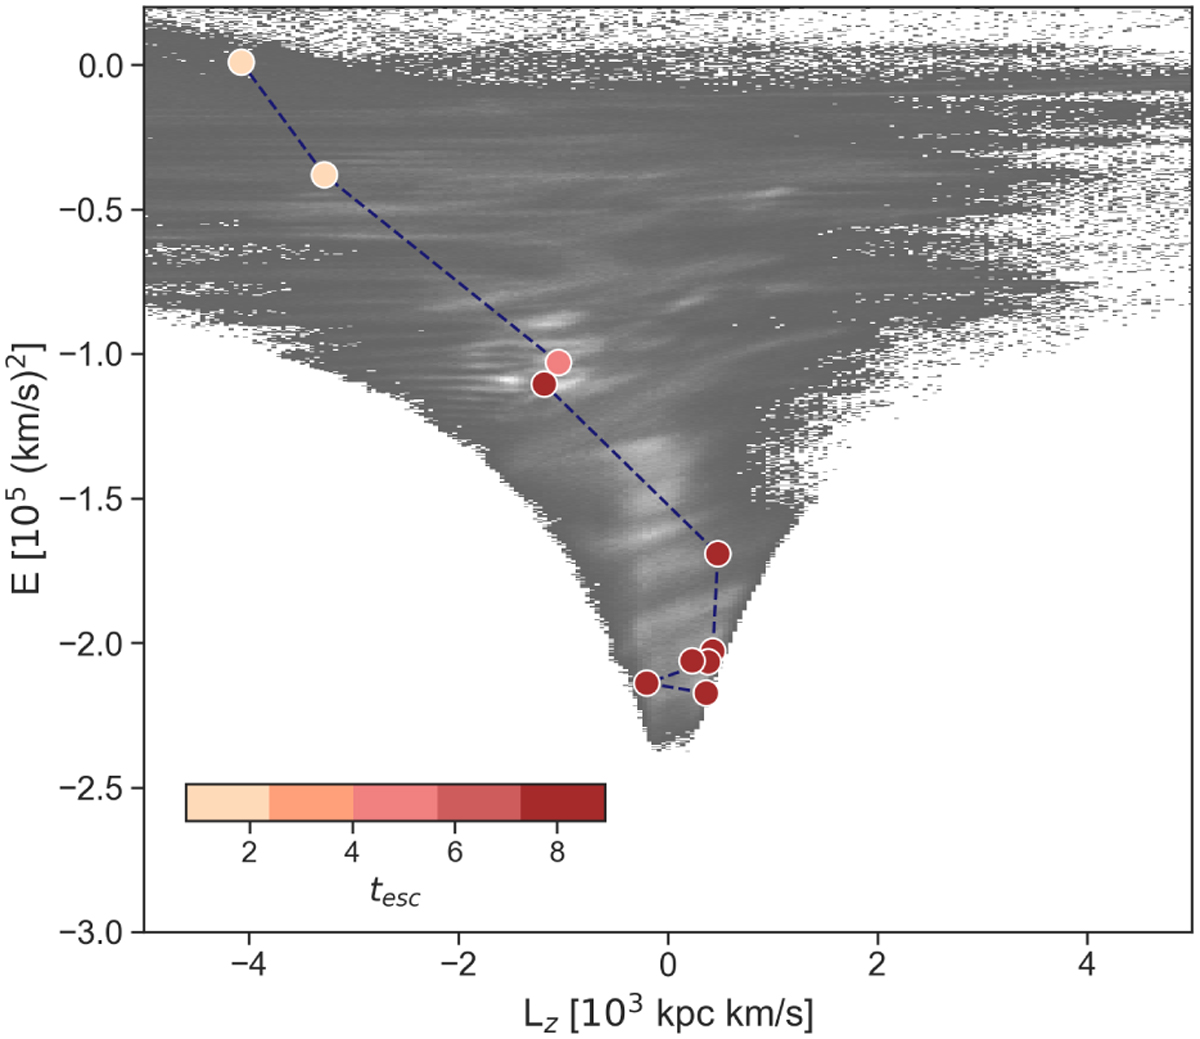
Distribution in E – Lz of a set of ten clusters accreted together with their progenitor galaxy on a MW-type galaxy through one of the N-body simulations presented in Pagnini et al. (2023) (identified in that paper with the ID=MWsat_nl_Φ180). Clusters are colour-coded according to their escape time from the progenitor satellite, which is defined as the time when the distance between the GC and the satellite’s centre of mass is larger than 15 kpc (see Sect. 3 in Pagnini et al. 2023 for the details). In the background, the distribution of field stars of the accreted satellite is also shown as a density map. Energies and angular momenta have been re-scaled to obtain a distribution comparable with that of the Galactic GCs and field stars presented in Fig. 7.
Current usage metrics show cumulative count of Article Views (full-text article views including HTML views, PDF and ePub downloads, according to the available data) and Abstracts Views on Vision4Press platform.
Data correspond to usage on the plateform after 2015. The current usage metrics is available 48-96 hours after online publication and is updated daily on week days.
Initial download of the metrics may take a while.