| Issue |
A&A
Volume 688, August 2024
|
|
|---|---|---|
| Article Number | A92 | |
| Number of page(s) | 12 | |
| Section | Galactic structure, stellar clusters and populations | |
| DOI | https://doi.org/10.1051/0004-6361/202347550 | |
| Published online | 07 August 2024 | |
Signature of systemic rotation in 21 galactic globular clusters from APOGEE-2
1
Instituto de Astrofísica, Facultad de Ciencias Exactas, Universidad Andrés Bello, Fernández Concha 700, Las Condes, Santiago, Chile
e-mail: This email address is being protected from spambots. You need JavaScript enabled to view it.
2
Vatican Observatory, Vatican City State 00120, Italy
3
Departamento de Fisica, Universidade Federal de Santa Catarina, Trinidade, 88040-900 Florianopolis, Brazil
4
Instituto de Astronomía, Universidad Católica del Norte, Av. Angamos 0610, Antofagasta, Chile
5
Centro de Investigación en Astronomía, Universidad Bernardo O’Higgins, Avenida Viel, 1497 Santiago, Chile
6
Astrophysics Research Institute, Liverpool John Moores University, 146 Brownlow Hill, Liverpool L3 5RF, UK
Received:
24
July
2023
Accepted:
26
March
2024
Abstract
Context. Traditionally, globular clusters (GCs) have been assumed to be quasi-relaxed non-rotating systems, characterized by spherical symmetry and orbital isotropy. However, in recent years, a growing set of observational evidence has been unveiling an unexpected dynamical complexity in Galactic GCs. Indeed, kinematic studies have demonstrated that a measurable amount of internal rotation is present in many present-day GCs.
Aims. The objective of this work is to analyse the APOGEE-2 value-added catalog (VAC) DR17 data of a sample of 21 GCs to extend the sample exhibiting signatures of systemic rotation and better understand the kinematic properties of GCs overall. Also, we aim to identify the fastest rotating GC from the sample of objects with suitable measurements.
Methods. From the sample of 23 GCs included in this work, the presence of systemic rotation was detected in 21 of the GCs, using three different methods. All these methods use the radial velocity referred to the cluster systemic velocity (Ṽr). Using the first method, it was possible to visually verify the clear-cut signature of systemic rotation; whereas using the second and third methods, it was possible to determine the amplitude of the rotation curve (Arot) and the position angle (PA) of the rotation axis.
Results. This study shows that 21 GCs have a signature of systemic rotation. For these clusters, the rotation amplitude and the position angle of the rotation axis (PA0) have been calculated. The clusters cover a remarkable range of rotational amplitudes, from 0.77 km s−1 to 13.85 km s−1.
Key words: stars: kinematics and dynamics / globular clusters: general
© The Authors 2024
 Open Access article, published by EDP Sciences, under the terms of the Creative Commons Attribution License (https://creativecommons.org/licenses/by/4.0), which permits unrestricted use, distribution, and reproduction in any medium, provided the original work is properly cited.
This article is published in open access under the Subscribe to Open model. This email address is being protected from spambots. You need JavaScript enabled to view it. to support open access publication.
1. Introduction
Galactic globular clusters (GCs) represent an ideal laboratory for studying stellar dynamics and its effects on stellar evolution. Traditionally, GCs have been assumed to be quasi-relaxed non-rotating systems, characterized by spherical symmetry and orbital isotropy. Spherical isotropic (King 1966) and non-rotating (Wilson 1975) models have indeed been shown to provide a satisfactory zeroth-order description of the main observed dynamical properties.
However, in recent years, a growing set of observational evidence is unveiling an unexpected dynamical complexity in Galactic GCs, demonstrating that the traditional assumptions of sphericity, pressure isotropy, and nonrotation are far too simplistic. In fact, kinematic studies have shown that a significant amount of internal rotation is present in many present-day Milky Way (MW) GCs (Lane et al. 2011; Bellazzini et al. 2012; Bianchini et al. 2013, 2018; Fabricius et al. 2014; Kacharov et al. 2014; Kimmig et al. 2015; Lardo et al. 2015; Bellini et al. 2017; Boberg et al. 2017; Jeffreson et al. 2017; Cordero et al. 2017; Lee 2017; Ferraro et al. 2018; Kamann et al. 2018; Lanzoni et al. 2018; Szigeti et al. 2021). All these results suggest that, since it is possible to study individual stellar components individually, the vast majority of GCs show signatures of the presence of internal rotation.
This observational evidence plays a fundamental role in constructing a complete dynamical picture of GCs. Indeed, the presence of a significant amount of internal rotation raises a series of fundamental issues related to the formation and evolution of GCs and the different dynamical processes involved (e.g., Giersz & Heggie 2011). For instance, many studies indicate that rotation accelerates evolution (e.g. Einsel & Spurzem 1999; Kim et al. 2008; Hong et al. 2013) and strongly shapes their present-day morphology (van den Bergh 2008; Bianchini et al. 2013). Moreover, the present-day signatures could be the relic of a stronger internal rotation set at the epoch of the cluster’s formation (Vesperini et al. 2014; Lee & Hennebelle 2016; Mapelli 2017; Tiongco et al. 2017) or indicate a peculiar evolutionary environment (Lane et al. 2010a; Vesperini et al. 2014; Tiongco et al. 2018). Signatures of internal rotation could also be crucial in the kinematical differences between multiple stellar populations (Richer et al. 2013; Bellini et al. 2015, 2018; Cordero et al. 2017; Cordoni et al. 2020a,b; Dalessandro et al. 2021; Libralato et al. 2023). As a result of these interesting studies, new theoretical models are being developed. Of great interest is the proposed new distribution-function-based models of rotating and anisotropic models (see, e.g., Varri & Bertin 2012; Gieles & Zocchi 2015; de Vita et al. 2016), expanding the traditional model. Several numerical simulations have also been carried out to understand the rotational properties of GCs (see, e.g., Einsel & Spurzem 1999; Ernst et al. 2007; Livernois et al. 2021, 2022; Kamlah et al. 2022; Tiongco et al. 2022). One of these was the starting point to find the first observational evidence of a relation between GCs’ internal rotation and stellar masses (Scalco et al. 2023). As shown from these theoretical studies, the presence of internal rotation has several implications for the long-term dynamical evolution of clusters (e.g., the observed GC rotation may be a lower limit to a GC’s initial rotation due to angular momentum loss during its evolution).
In this work, we carried out a kinematic analysis for 23 Galactic GCs to verify the presence of a systemic rotation in these objects. This study is based on the individual radial velocities of stars available for each individual cluster. The data come from the high-resolution spectroscopic survey Apache Point Observatory Galactic Evolution Experiment (APOGEE; Majewski et al. 2016). The astrometric parameters, such as the position (RA and Dec; see Vasiliev & Baumgardt 2021), the abundances, and the radial velocity referred to the cluster systemic velocity ( ), had previously been calculated for all stars (see Schiavon et al. 2023). For this reason, the available catalog represents a good sample for the purposes of this study.
The present work is structured as follows. In Sect. 2, we present the data available for the sample GCs that were employed in the calculations. Section 3 includes a kinematic analysis, while in Sect. 4 the results are summarized and discussed. Our conclusions are drawn in Sect. 5.
2. Available data
The data used to conduct this analysis were collected from two different catalogs. The first is a list of globular cluster (GC) star members from the latest data release of the SDSS-IV/APOGEE-2 survey (DR171, Majewski et al. 2017; Abdurro’uf et al. 2022). Cluster membership is based on a combination of position, proper motion, radial velocity, and metallicity cuts obtained using data from both the APOGEE-2 (DR17) and Gaia (EDR3) surveys (Gaia Collaboration 2021). The second catalog contains the global parameters adopted for GCs included in the cluster member value-added catalogs (VACs) generated from APOGEE-2 DR17 (Schiavon et al. 2023).
The list of GCs and their characteristics considered in this work is shown in Table 1. This table lists the GC positions, the Jacobi radius, the number of stars, the velocity dispersion, the fitted and peak-to-peak amplitudes, the position angle of the rotation axis, and the parameter Afit/σrv for each GCs. The number of stars observed varies from cluster to cluster, but each cluster has at least 60 stars available. In general, the number of observed stars varies from 65 to 1864. We emphasize that the number of available stars for each cluster doubles the previous APOGEE sample. Further details about these APOGEE-2 data and their acquisition and reduction techniques and the criteria adopted for selecting candidate GC members are presented in Schiavon et al. (2023).
Summary of the GCs analysed in this work.
3. Kinematic analysis
Among the various available parameters, of particular importance for this analysis is the radial velocity referred to the cluster’s systemic velocity ( ); namely, the difference between the radial velocity of star (Vr) and the systemic velocity of the GC (Vsys) in units of the adopted radial velocity dispersion (σrv)2 (see Eq. (1)).
![Mathematical equation: $$ \begin{aligned} \widetilde{V}_{r} = (V_{r} - V_{\mathrm{sys}}), \qquad [\mathrm{km\,s}^{-1}],\\ \end{aligned} $$](/articles/aa/full_html/2024/08/aa47550-23/aa47550-23-eq4.gif) (1)
(1)
Indeed, all methods used in this work to check the presence of rotation in GCs are based on  .
.
A quick and visually efficient method to check for systemic rotation in GCs is to use the distribution of the stars with different Vr on the plane of the sky (Fig. 1), with the red and the blue colors indicating, respectively, positive and negative values of  (i.e., Vr larger and smaller than the systemic velocity, respectively). As apparent from the figure, the evident prevalence of stars with positive values of
  in the lower-right portion of the map and that of sources with
  in the upper-left part of the diagram is a clear-cut signature of systemic rotation.
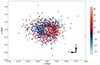 |
Fig. 1. Distribution of the observed sample on the plane of the sky of NGC 5139, with x = (RA0 − RA) ⋅ cos(Dec) and y = Dec − Dec0 (RA0 and Dec0 being the coordinates of the cluster center, adopted from Vasiliev & Baumgardt 2021 catalog). The colors distinguish stars with radial velocities referred to the cluster systemic velocity ( |


To investigate the rotation in GCs, we used the same method as that adopted by Cote et al. (1995), Pancino et al. (2007), and Lane et al. (2010b), which is also fully described in Bellazzini et al. (2012) and Lanzoni et al. (2013). For any given cluster, the method consists of splitting the sample in two, by considering a line passing through the cluster center with the PA varying between 0° (north direction) and 90° (east direction), using steps of 18°3, clockwise system4. For each value of the PA, the difference  between the mean radial velocity of the two sub-samples was computed and it is plotted as a function of the PA (see, e.g., Fig. 2). Its coherent sinusoidal behavior is a signature of rotation and the parameters of the best-fit sine function provide us with the amplitude of the rotation curve and the PA of the rotation axis (for the exact meaning of this parameter, see the discussion in Bellazzini et al. 2012). The observed patterns were fitted with the sine law, which provides a reasonable fit to the data, and is shown in Eq. (2):
 (2)
(2)
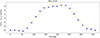 |
Fig. 2. Difference between the mean radial velocities of the stars located on each side of the cluster with respect to a line passing through the center as a function of PA (measured from north, PA = 0°, to east, PA = 90°, with a step of 18°, clockwise system) for the globular cluster NGC 5139. The orange dashed line is the sine function that best fits the observed patterns (blue dots). |
where dist is the displacement, ω is frequency, and ϕ is the phase of the best-fit sine function5. Also, Arot is the rotation amplitude, which is two times the actual mean amplitude, because it is the difference of the two hemispheres (in km s−1). The minimum and maximum position in the best-fit sine function is the position angle of the dividing line corresponding to the maximum rotation amplitude (in degrees), coinciding with the rotation axis. It should be noted, however, that the values of the PA of the rotational axis (PA0) given in the Table 1 are indicative estimates of the actual values. The rotation amplitude derived from the best-fit function for all GCs (Afit) is shown in Table 1, while the observed patterns with the best-fit sine function of all GCs are shown in Appendix D.
In this work, another method was also used to calculate the rotation amplitude, namely, the peak-to-peak approach. In this case, the values of absolute minimum and absolute maximum of  among all the observed patterns are identified and the amplitude of the rotation is the difference between the maximum value and the minimum value, namely,
  . The rotation amplitude obtained from this method for all GCs (Apeak − peak) is shown in Table 1.
As regards the best-fit sine function method, we derive the rotation amplitude and its uncertainty using the SCIPY6 package of PYTHON. Indeed, this package allows us to derive the parameters of the best-fit sine function, such as the rotation amplitude, and their uncertainties. On the other hand, in the case of the peak-to-peak approach, the measurement of uncertainties of the rotation amplitudes was calculated starting from the uncertainties of the radial velocities of each star member of the cluster and the uncertainty of the systemic velocity of the cluster and considering the propagation of these uncertainties. The final value of uncertainty of rotation amplitude is given by the quadrature sum of the uncertainties of the observed patterns. As can be noted from the results reported in the Table 1, the values of the uncertainty calculated for the peak-to-peak approach are slightly high, especially for some clusters with a low number of available stars. In general, the APOGEE velocities are smaller than 1 km s−1. Thus, excluding the individual stars with large radial velocity errors does not indicate any large discrepancy with the reported results.
4. Results and discussion
In this work, we studied 23 GCs to reveal a possible presence of systemic rotation. In this analysis, the rotation patterns were detected from radial velocities. Note that the rotation amplitudes detected from Vr samples are just lower limits to the true 3D amplitude, because of the projection onto the plane of the sky (Bellazzini et al. 2012). Moreover, it must also be noted that the amplitude generally varies significantly with distance from the cluster center (see, for example, the case of ω Cen Sollima et al. 2009), but the Arot, derived using the full range of radius, is a reasonable proxy for the actual maximum amplitude (see Pancino et al. 2007).
As a primary result, we find that 21 GCs show a systemic rotation and cover a remarkable range of rotational amplitudes, from ∼0.77 km s−1 to ∼13.85 km s−1. For these clusters, we have also derived the PA of the rotation axis. The Arot and PA0 values of these clusters are shown in Table 1.
Once the clusters that show the signature of systemic rotation have been detected and their Arot and PA0 have been calculated, we have identified the fastest rotating GCs in our sample. As reported in Bellazzini et al. (2012), Kacharov et al. (2014), and Alfaro-Cuello et al. (2020), the parameter Arot/σ (or with the most commonly used nomenclature V/σ), namely, the rotation amplitude divided by velocity dispersion of the cluster, can be used for this purpose. Indeed, this parameter is expected to capture the relevance of rotation with respect to random motions. In this work, the parameter Arot/σ was calculated using the rotation amplitude derived from the best-fit sine function and the adopted radial velocity dispersion (Afit and σrv in the Table 1). In Table 1, the values of this parameter are shown for each cluster of the sample. According to the results obtained, the fastest GCs are NGC 5904, NGC 5139, and NGC 0104.
As a final analysis, a comparison between the rotation amplitude values obtained from the best-fit sine function of the observed patterns and the rotation amplitude values derived from the peak-to-peak method was made. As can be seen in the Table 1, the calculated amplitudes are within the uncertainties of each other, but in some cases, there are significant differences between the two methods (e.g., 6.64 km s−1 versus 11.68 km s−1 for NGC 6388). Moreover, for a few GCs, the peak-to-peak approach returns slightly high uncertainty values. The result of this comparison is shown in Fig. 3. In this figure, the values of Afit and Apeak − peak (black dots) for each GCs were plotted and a linear regression was performed to find the line that best fit the data (red line). As a result, the best-fit line is:
 (3)
(3)
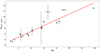 |
Fig. 3. Comparisons of rotation amplitude values obtained from the sinusoidal best-fit function and the peak-to-peak approach. The black dots are the values of the rotation amplitude for each GCs, while the red line is the best-fit line obtained from the linear regression. |
Consequently, due to the slightly high uncertainty values from the peak-to-peak approach for a few GCs, the derivation of rotation amplitude from the best-fit sine function method is the most accurate. However, given the best-fit equation, it can be concluded that the use of the two methods gives equivalent results. Indeed, both methods can be considered two good tools for determining the rotation amplitudes.
4.1. Comparison with the literature
The signature of systemic rotation for these GCs is consistent with the works of Lane et al. (2010b), Bellazzini et al. (2012), Fabricius et al. (2014), Cordero et al. (2017), Johnson et al. (2017), Kamann et al. (2018), Bianchini et al. (2018), Ferraro et al. (2018), Lanzoni et al. (2018), Sollima et al. (2019), and Szigeti et al. (2021). Among these, the following works are of particular interest: Lane et al. (2010b), Bellazzini et al. (2012), Bianchini et al. (2013), Lardo et al. (2015), Kimmig et al. (2015), Lee (2017), and Ferraro et al. (2018) and Lanzoni et al. (2018), because they used the same method as in this work to analyse the same clusters, and the work of Szigeti et al. (2021) because they used data from APOGEE-2 survey. Since all clusters have been studied in the literature before, it is possible to compare the results of the present homogeneous sample with these other previous studies. The latest results available in the literature were collected in Table E.1, which contains the calculated rotation amplitude and position angles of the rotational axis. Since multiple conventions are used in the literature for angle and direction notations (e.g., in the work of Fabricius et al. 2014; Cordero et al. 2017; Kamann et al. 2018; Sollima et al. 2019), the published results have been converted the PA 90 = east convention, anti-clockwise system. The conversion of the PA0 values of these works can be found in Appendix A. The PA0 values measured in this work and shown in Table 1 have also been converted. To convert the values into the reference notation, a subtraction was performed between 360° and the measured PA0 value for each cluster.
As reported above, one of the most relevant works with which to compare the results is the study of Szigeti et al. (2021), because in this work APOGEE data have also been used. However, our study shows some differences in terms of available data. The first difference is that Szigeti et al. (2021) used the DR14 data release of APOGEE (Holtzman et al. 2018), while we used the expanded DR17 data release of APOGEE (Schiavon et al. 2023). Two other differences are the number of GCs analysed and the stars observed for each individual cluster. Indeed, Szigeti et al. (2021) studied a total of ten GCs, but they were able to successfully measure the rotation speed and position angle of the rotation axis for nine clusters. Instead, in our work, we more than doubled the sample to a total of 23 GCs and we were able to successfully measure the rotation amplitude and the position angle of the rotation axis for 21 clusters. Moreover, the number of stars observed for each individual cluster varies from 26 to 215 in Szigeti et al. (2021); whereas it varies from 65 to 1864 in our work. Despite these differences in data, the methodology to investigate the rotation amplitude and the position angle of the rotational axis of the clusters (i.e., the second method described in Sect. 3) is similar; thus it is possible to compare the results of the two works.
As noted from Table E.1, the comparison between our results and those reported in literature works shows some discrepancies. In particular, even for the best-studied case (NGC 5139 with 1864 stars), the results are not always consistent with the literature. As regards the rotation amplitude, there is a factor of ∼2 discrepancy present in almost every cluster. This can be explained by considering that the rotation amplitude is usually taken to be half of the amplitude of the sinusoidal function (see, e.g., Lane et al. 2011; Szigeti et al. 2021). Even the position angle of the rotational axis values in this work are different from those reported in the literature. Some of these discrepancies (especially for the clusters with a lower number of stars) can be explained by different field of view used in the data (e.g., Kamann et al. 2018 focuses on more central FoVs), the different data used (e.g., Sollima et al. 2019 derived 3D rotation amplitudes from the proper motion and line-of-sight velocity simultaneously), or the lack of perspective correction (e.g., van de Ven et al. 2006). However, other effects may also be responsible for the discrepancies between this work and those of the literature (and in some cases also between one literature work and another). The first depends on the observed patterns and the definition of the best-fit sine function that fits these points. A different position of the observed patterns or different fit of the sine function can lead to discrepant results. As in the case of NGC 5139 (ω Cen) that does not show a minimum or maximum position in the best-fit sine function at low values of PA (as shown instead in the work of Bianchini et al. 2013), but the minimum or maximum is present to higher values of PA. This can explain the high PA0 value obtained in this work compared to the other literature work7. The same applies to the globular cluster NGC 6205, in the case of which the work of Szigeti et al. (2021) notes a minimum position at lower PA, while in this work it is to higher PA values. In both of these cases, the observed patterns, and consequently the best fits, are similar to those reported in the literature works, but with a shift that varies the PA0 results. A different situation is that of the GCs NGC 2808, NGC 3201, NGC 5904, and NGC 7078. In this case, the position of the observed patterns and the definition of the best-fit sine function definitely diverge from those reported in the literature, causing discrepancies in the PA0 values. Furthermore, although the same method and the convention PA 90 = east anti-clockwise system were used to define the observed patterns and the best-fit sine function, different approaches have been adopted to determine PA0 in different works. For instance, Ferraro et al. (2018) consider only the minimum position in the best-fit sine function to derive the PA0 for the GCs NGC 5272, NGC 3201, NGC 0362, NGC 6171, and NGC 6254; whereas this work takes into account both the minimum and maximum position (the same method used in Szigeti et al. 2021). Instead, Lardo et al. (2015) considered only the maximum position in the best-fit sine function for the GCs NGC 2808, NGC 6752, NGC 7078, and NGC 1851. Another method was presented by Bellazzini et al. (2012), where they derived the PA0 value from the best-fit equation using the formula ϕ = 270° − PA0 (where ϕ is the phase of best-fit sine function) for the GCs NGC 5904, NGC 2808, NGC 7078, NGC 1851, NGC 6171, NGC 6254, and NGC 6388. All these effects mentioned above may be responsible for the discrepancies in PA0 between this work and those in the literature.
The last comparison with the literature regards the two GCs, NGC 6218, and NGC 6838, that do not show a coherent sinusoidal pattern in the figures8 derived from the second method described in Sect. 3 (see Appendix B). Consequently, there is no clear sign of rotation for these two clusters and for these clusters, it was not possible to measure Arot (neither with the best-fit sine function nor with the peak-to-peak approach, see Sect. 3) and PA0. In the literature, both clusters have been studied by Bellazzini et al. (2012), Kimmig et al. (2015) and Bianchini et al. (2018) and in these works, they found a signature of rotation. As explained in Bellazzini et al. (2012), a work that uses the same adopted technique in this analysis, the results may also suffer from biases associated with the dimension of the samples for each GCs and with the radial distribution of sample stars. Moreover, the data used in Bellazzini et al. (2012), Kimmig et al. (2015) and Bianchini et al. (2018) come from FLAMES-GIRAFFE sample, Hectochelle on the MMT telescope, and Gaia DR2 respectively, while the data of this work come from APOGEE-2 DR17 and Gaia (EDR3). Therefore, more observational data are required to verify the presence of systemic rotation in the GCs NGC 6218 and NGC 6838.
4.2. General considerations
Below, we present two interesting considerations regarding the available data and possible effects that could influence the detection of the systemic rotation in the GCs.
An important effect that can produce a non-negligible amount of apparent rotation is the perspective rotation. It is particularly relevant for GCs that display a large extent on the plane of the sky. For example, for NGC 5139 (ω Cen), this effect can be extremely relevant (see for example Merritt et al. 1997 and van de Ven et al. 2006). Indeed, as reported in van de Ven et al. (2006), for the data typically extending to 20 arcmin from the ω Cen cluster center, the maximum amplitude of the perspective rotation for the proper motions is about 0.06 mas yr−1 and for the line-of-sight velocity about 0.8 km s−1. These values are a significant fraction of the observed mean velocities shown in this work from the literature, so the perspective rotation cannot be ignored. For this reason, we calculated the perspective rotation for ω Cen, which is the GC with the largest extent on the plane of the sky in our sample of clusters, using our available data and the technique described in van de Ven et al. (2006). As PA0 we considered the value derived in this work, namely 162°. To derive the values of the perspective rotation for each star, we applied Eq. (6) from the cited literature work, adopting the canonical distance of 5 kpc and the systemic motion given in Eq. (3) from that work. The perspective rotation of each star is insignificant compared to its  , so it could be ignored. Nevertheless, we corrected the observed stellar velocities by subtracting it. As a result, the kinematic data corrected for perspective rotation return a Afit value of 13.69 km s−1 (instead of 13.85 km s−1 without correction) and a Apeak − peak value of 13.32 km s−1 (instead of 12.98 km s−1). The difference between the values with and without correction is extremely low, so the effect of perspective rotation is negligible. Since this effect is inappreciable for ω Cen and all the other clusters analyzed in this work have a Jacobi radius (considered as a parameter for the size of the field of view sampled) that is lower than that of ω Cen (see Table 1), we did not correct the observed velocities for perspective rotation in this work.
The strategy for using the fitting of a sine law is commonly used to detect rotation from resolved kinematics. It is a reasonably good method to estimate the PA of the rotation axis. However, for the estimation of the rotation amplitude, it presents a major drawback. Indeed, given that GCs are characterized by differential rotation curves, the value of the rotation amplitude measured with this method strongly depends on the spatial distribution of the line-of-sight velocity samples. A differential rotation profile of a GC usually peaks around 1–2 half-light radii. Therefore, if the data do not sample this region, they will systematically show a lower rotation value – and vice versa if they are concentrated around these intermediate regions. Nevertheless, as in Lanzoni et al. (2018), for example, the authors tested the variability of their results considering different radii and found that the rotation amplitude and the position angle of the rotation axis are essentially constant in all of the investigated radii; this is expected in the case of a coherent global rotation of the system. In this cited work, the authors considered a set of concentric annuli around the cluster center of NGC 5904, avoiding the innermost region, where the statistics is poor, and the outermost region, where the sampling is scant and nonsymmetric. As a result of this test (see Table 2 and Fig. 7 of the reference paper), the values of Arot and PA0 are very similar between the annulus and the other. For this reason, since we are considering the case of a coherent global rotation for each GC, we did not carry out a test on the variability of the results at different radii here.
5. Conclusions
In this work, we studied 23 GCs to verify the presence or not of systemic rotation. Below, we present the main conclusions of this analysis:
-
Using the data and methods described in this analysis, 21 GCs show a signature of systemic rotation. For these clusters, the rotation amplitude and the PA of the rotation axis were calculated. As a result, the clusters cover a remarkable range of rotational amplitudes, from ∼0.77 km s−1 to ∼13.85 km s−1. In particular, the clusters that exhibit highest rotation are NGC 5904, NGC 5139 and NGC 0104.
-
Two different methods have been used to calculate the rotation amplitude: the best-fit sine function and the peak-to-peak methods. A comparison between the two methods shows they give similar results, within the uncertainties.
-
The comparison with the literature shows that our measurements are generally consistent with previously published rotation values.
In conclusion, most (if not all) of the present-day GCs display a measurable rotation. Processes such as interactions can induce rotation in some individual cases, but it is very difficult to individually spin up the whole population of such massive objects (> 104 M⊙). Therefore, we surmise that this trait was probably imprinted initially, during the epoch of their process of formation (see e.g., Kamann et al. 2018 and Bianchini et al. 2018). With the advent of large spectroscopic surveys such as 4MOST (Chiappini et al. 2019) and WEAVE (Jin et al. 2023), it will be possible to explore the rotational properties of larger homogeneous GCs samples in greater detail.
In this work, the adopted radial velocity dispersion values are referred to global dispersion.
This value is the same for all GCs studied and was chosen to divide the range of PA values equally and while at the same time considering a significant number of stars for each range in order to perform the analysis described. Further details explaining the choice of using this step value are given in Appendix C.
This convention is different from that used in reference works that adopt the same analysis methodology. Thus, to compare our results with those of literature works, we convert and report the values into the reference notation, namely PA 90 = east, anti-clockwise system.
The values of dist, ω, ϕ have no relevance for the kinematic analysis in this work, but these coefficients are only relevant in the computational part. Indeed, they were included in the formula only to improve and find the best-fit sine function.
A high position angle value has also been derived in van de Ven et al. (2006) for ω Cen. In this work, the position angle has been defined as the angle between the observed major axis and north (measured counterclockwise via the east) and determined by fitting elliptic isophotes to the smoothed Digital Sky Survey (DSS) image of the cluster, while keeping the center fixed. In this way, the position angle is about 100°, a value discrepant to other values reported in the literature.
The reference figures are those that show the difference between the mean radial velocities of the stars located on each side of the cluster with respect to a line passing through the cluster center as a function of PA (measured from north to east, north = 0°, east = 90°, with a step of 18°, clockwise system).
Acknowledgments
I.P. acknowledges support from ANID BECAS/DOCTORADO NACIONAL 21230761. J.G.F.-T. acknowledges support provided by Agencia Nacional de Investigación y Desarrollo de Chile (ANID) under the Proyecto Fondecyt Iniciación 2022 Agreement No. 11220340, and from ANID under the Concurso de Fomento a la Vinculación Internacional para Instituciones de Investigación Regionales (Modalidad corta duración) Agreement No. FOVI210020, and from the Joint Committee ESO-Government of Chile 2021 under the Agreement No. ORP 023/2021, and from Becas Santander Movilidad Internacional Profesores 2022, Banco Santander Chile, and from Vicerrectoría de Investigación y Desarrollo Tecnológico (VRIDT) at Universidad Católica del Norte under resolución No. 061/2022-VRIDT-UCN. D.M. gratefully acknowledges support from the ANID BASAL projects ACE210002 and FB210003, from Fondecyt Project No. 1220724, and from CNPq Project 350104/2022-0.
References
- Abdurro’uf, Accetta, K., Aerts, C., et al. 2022, ApJS, 259, 35 [NASA ADS] [CrossRef] [Google Scholar]
- Alfaro-Cuello, M., Kacharov, N., Neumayer, N., et al. 2020, ApJ, 892, 20 [CrossRef] [Google Scholar]
- Bellazzini, M., Bragaglia, A., Carretta, E., et al. 2012, A&A, 538, A18 [NASA ADS] [CrossRef] [EDP Sciences] [Google Scholar]
- Bellini, A., Vesperini, E., Piotto, G., et al. 2015, ApJ, 810, L13 [NASA ADS] [CrossRef] [Google Scholar]
- Bellini, A., Bianchini, P., Varri, A. L., et al. 2017, ApJ, 844, 167 [NASA ADS] [CrossRef] [Google Scholar]
- Bellini, A., Libralato, M., Bedin, L. R., et al. 2018, ApJ, 853, 86 [NASA ADS] [CrossRef] [Google Scholar]
- Bianchini, P., Varri, A. L., Bertin, G., & Zocchi, A. 2013, ApJ, 772, 67 [NASA ADS] [CrossRef] [Google Scholar]
- Bianchini, P., van der Marel, R. P., del Pino, A., et al. 2018, MNRAS, 481, 2125 [Google Scholar]
- Boberg, O. M., Vesperini, E., Friel, E. D., Tiongco, M. A., & Varri, A. L. 2017, ApJ, 841, 114 [NASA ADS] [CrossRef] [Google Scholar]
- Chiappini, C., Minchev, I., Starkenburg, E., et al. 2019, Messenger, 175, 30 [NASA ADS] [Google Scholar]
- Cordero, M. J., Hénault-Brunet, V., Pilachowski, C. A., et al. 2017, MNRAS, 465, 3515 [NASA ADS] [CrossRef] [Google Scholar]
- Cordoni, G., Milone, A. P., Mastrobuono-Battisti, A., et al. 2020a, ApJ, 889, 18 [Google Scholar]
- Cordoni, G., Milone, A. P., Marino, A. F., et al. 2020b, ApJ, 898, 147 [NASA ADS] [CrossRef] [Google Scholar]
- Cote, P., Welch, D. L., Fischer, P., & Gebhardt, K. 1995, ApJ, 454, 788 [NASA ADS] [CrossRef] [Google Scholar]
- Dalessandro, E., Raso, S., Kamann, S., et al. 2021, MNRAS, 506, 813 [CrossRef] [Google Scholar]
- de Vita, R., Bertin, G., & Zocchi, A. 2016, A&A, 590, A16 [NASA ADS] [CrossRef] [EDP Sciences] [Google Scholar]
- Einsel, C., & Spurzem, R. 1999, MNRAS, 302, 81 [NASA ADS] [CrossRef] [Google Scholar]
- Ernst, A., Glaschke, P., Fiestas, J., Just, A., & Spurzem, R. 2007, MNRAS, 377, 465 [NASA ADS] [CrossRef] [Google Scholar]
- Fabricius, M. H., Noyola, E., Rukdee, S., et al. 2014, ApJ, 787, L26 [NASA ADS] [CrossRef] [Google Scholar]
- Ferraro, F. R., Mucciarelli, A., Lanzoni, B., et al. 2018, ApJ, 860, 50 [NASA ADS] [CrossRef] [Google Scholar]
- Gaia Collaboration (Brown, A. G. A., et al.) 2021, A&A, 649, A1 [NASA ADS] [CrossRef] [EDP Sciences] [Google Scholar]
- Gieles, M., & Zocchi, A. 2015, MNRAS, 454, 576 [NASA ADS] [CrossRef] [Google Scholar]
- Giersz, M., & Heggie, D. C. 2011, MNRAS, 410, 2698 [NASA ADS] [CrossRef] [Google Scholar]
- Holtzman, J. A., Hasselquist, S., Shetrone, M., et al. 2018, AJ, 156, 125 [Google Scholar]
- Hong, J., Kim, E., Lee, H. M., & Spurzem, R. 2013, MNRAS, 430, 2960 [NASA ADS] [CrossRef] [Google Scholar]
- Jeffreson, S. M. R., Sanders, J. L., Evans, N. W., et al. 2017, MNRAS, 469, 4740 [NASA ADS] [CrossRef] [Google Scholar]
- Jin, S., Trager, S. C., Dalton, G. B., et al. 2023, MNRAS, 530, 2688 [Google Scholar]
- Johnson, C. I., Caldwell, N., Rich, R. M., et al. 2017, ApJ, 836, 168 [NASA ADS] [CrossRef] [Google Scholar]
- Kacharov, N., Bianchini, P., Koch, A., et al. 2014, A&A, 567, A69 [NASA ADS] [CrossRef] [EDP Sciences] [Google Scholar]
- Kamann, S., Husser, T. O., Dreizler, S., et al. 2018, MNRAS, 473, 5591 [NASA ADS] [CrossRef] [Google Scholar]
- Kamlah, A. W. H., Spurzem, R., Berczik, P., et al. 2022, MNRAS, 516, 3266 [CrossRef] [Google Scholar]
- Kim, E., Yoon, I., Lee, H. M., & Spurzem, R. 2008, MNRAS, 383, 2 [NASA ADS] [CrossRef] [Google Scholar]
- Kimmig, B., Seth, A., Ivans, I. I., et al. 2015, AJ, 149, 53 [NASA ADS] [CrossRef] [Google Scholar]
- King, I. R. 1966, AJ, 71, 64 [Google Scholar]
- Lane, R. R., Brewer, B. J., Kiss, L. L., et al. 2010a, ApJ, 711, L122 [NASA ADS] [CrossRef] [Google Scholar]
- Lane, R. R., Kiss, L. L., Lewis, G. F., et al. 2010b, MNRAS, 406, 2732 [Google Scholar]
- Lane, R. R., Kiss, L. L., Lewis, G. F., et al. 2011, A&A, 530, A31 [NASA ADS] [CrossRef] [EDP Sciences] [Google Scholar]
- Lanzoni, B., Mucciarelli, A., Origlia, L., et al. 2013, ApJ, 769, 107 [NASA ADS] [CrossRef] [Google Scholar]
- Lanzoni, B., Ferraro, F. R., Mucciarelli, A., et al. 2018, ApJ, 861, 16 [NASA ADS] [CrossRef] [Google Scholar]
- Lardo, C., Pancino, E., Bellazzini, M., et al. 2015, A&A, 573, A115 [NASA ADS] [CrossRef] [EDP Sciences] [Google Scholar]
- Lee, J.-W. 2017, ApJ, 844, 77 [NASA ADS] [CrossRef] [Google Scholar]
- Lee, Y.-N., & Hennebelle, P. 2016, A&A, 591, A30 [NASA ADS] [CrossRef] [EDP Sciences] [Google Scholar]
- Libralato, M., Vesperini, E., Bellini, A., et al. 2023, ApJ, 944, 58 [CrossRef] [Google Scholar]
- Livernois, A., Vesperini, E., Tiongco, M., Varri, A. L., & Dalessandro, E. 2021, MNRAS, 506, 5781 [NASA ADS] [CrossRef] [Google Scholar]
- Livernois, A. R., Vesperini, E., Varri, A. L., Hong, J., & Tiongco, M. 2022, MNRAS, 512, 2584 [NASA ADS] [CrossRef] [Google Scholar]
- Majewski, S. R., APOGEE Team,& APOGEE-2 Team 2016, Astron. Nachr., 337, 863 [NASA ADS] [CrossRef] [Google Scholar]
- Majewski, S. R., Schiavon, R. P., Frinchaboy, P. M., et al. 2017, AJ, 154, 94 [NASA ADS] [CrossRef] [Google Scholar]
- Mapelli, M. 2017, MNRAS, 467, 3255 [NASA ADS] [CrossRef] [Google Scholar]
- Merritt, D., Meylan, G., & Mayor, M. 1997, AJ, 114, 1074 [NASA ADS] [CrossRef] [Google Scholar]
- Pancino, E., Galfo, A., Ferraro, F. R., & Bellazzini, M. 2007, ApJ, 661, L155 [NASA ADS] [CrossRef] [Google Scholar]
- Richer, H. B., Heyl, J., Anderson, J., et al. 2013, ApJ, 771, L15 [NASA ADS] [CrossRef] [Google Scholar]
- Scalco, M., Livernois, A., Vesperini, E., et al. 2023, MNRAS, 522, L61 [NASA ADS] [CrossRef] [Google Scholar]
- Schiavon, R. P., Phillips, S. G., Myers, N., et al. 2023, MNRAS, 528, 1393 [Google Scholar]
- Sollima, A., Bellazzini, M., Smart, R. L., et al. 2009, MNRAS, 396, 2183 [CrossRef] [Google Scholar]
- Sollima, A., Baumgardt, H., & Hilker, M. 2019, MNRAS, 485, 1460 [Google Scholar]
- Szigeti, L., Mészáros, S., Szabó, G. M., et al. 2021, MNRAS, 504, 1144 [NASA ADS] [CrossRef] [Google Scholar]
- Tiongco, M. A., Vesperini, E., & Varri, A. L. 2017, MNRAS, 469, 683 [NASA ADS] [Google Scholar]
- Tiongco, M. A., Vesperini, E., & Varri, A. L. 2018, MNRAS, 475, L86 [NASA ADS] [CrossRef] [Google Scholar]
- Tiongco, M. A., Vesperini, E., & Varri, A. L. 2022, MNRAS, 512, 1584 [NASA ADS] [CrossRef] [Google Scholar]
- van de Ven, G., van den Bosch, R. C. E., Verolme, E. K., & de Zeeuw, P. T. 2006, A&A, 445, 513 [NASA ADS] [CrossRef] [EDP Sciences] [Google Scholar]
- van den Bergh, S. 2008, AJ, 135, 1731 [NASA ADS] [CrossRef] [Google Scholar]
- Varri, A. L., & Bertin, G. 2012, A&A, 540, A94 [NASA ADS] [CrossRef] [EDP Sciences] [Google Scholar]
- Vasiliev, E., & Baumgardt, H. 2021, MNRAS, 505, 5978 [NASA ADS] [CrossRef] [Google Scholar]
- Vesperini, E., Varri, A. L., McMillan, S. L. W., & Zepf, S. E. 2014, MNRAS, 443, L79 [NASA ADS] [CrossRef] [Google Scholar]
- Wilson, C. P. 1975, AJ, 80, 175 [NASA ADS] [CrossRef] [Google Scholar]
Appendix A: PA0 conversions
This appendix includes the details of the conversions of the position angle of the rotation axis values reported in the works of Fabricius et al. 2014, Cordero et al. 2017, Kamann et al. 2018, and Sollima et al. 2019 into the north, PA = 0°, to east, PA = 90°, anti-clockwise system (traditional reference system). In each case, PA0 is the final position angle of the rotation axis used in this paper, after conversion into the north, PA = 0°, to east, PA = 90°, anti-clockwise system, and PA0, * is the position angle of the rotation axis reported in the studies listed above.
In Fabricius et al. 2014, the kinematic position angle has been obtained from the velocity field. Since the values of PA0, * of GCs in common with this work cover between 0° and 180°, the value of PA0 in the traditional reference system is equal to the sum of the PA0, * and 90°.
In the case of Cordero et al. 2017, the value of the PA0 is that converted and reported in Szigeti et al. 2021.
In Kamann et al. 2018, the values of PA0 are written in the PA = 0°, to east, PA = 90°, anti-clockwise system. However, the range of PA0, * values does not cover from 0° to 360° (where all values are positive). Indeed, in this work, the ranges of PA0, * values are between [0°, 180°], [-180°, -0°]. Therefore, to convert the reported values, the following algorithm is used:
-
If 0° < PA0, * < 180°, then the value of PA0 in the traditional reference system is equal to PA0, *;
-
If 0° < PA0, * < −180° (namely 180° < PA0 < 360° in the traditional reference system), then PA0 = 360° - |PA0, *|
Sollima et al. 2019 used the convention from north, PA = 0°, to west, PA = 90°, anti-clockwise system. Therefore, in this case the following algorithm is used:
-
If 0° < PA0, * < 180°, then the value of PA0 in the traditional reference system is 180°- PA0, *
-
Otherwise, if PA0, * > 180°, then the value of PA0 in the traditional reference system is 360°- PA0, *
Appendix B: GCs without signature of systemic rotation
This appendix reports the difference between the mean radial velocities of the stars located on each side of the cluster with respect to a line passing through the center as a function of PA (measured from north, PA = 0°, to east, PA = 90°, with a step of 18°, clockwise system) for the GCs NGC 6218 and NGC 6838. These figures do not show coherent sinusoidal behavior of the observed patterns (blue dots), thus these clusters do not show a signature of systemic rotation.
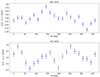 |
Fig. B.1. Difference between the mean radial velocities of the stars located on each side of the cluster with respect to a line passing through the center as a function of PA (measured from north, PA = 0°, to east, PA = 90°, with a step of 18°, clockwise system) for the globular clusters NGC 6218 (top) and NGC 6838 (bottom). |
Appendix C: Test to assess step value
This appendix explores the choice of using a step of 18° in the second and third methods described in Section 3 to calculate the Arot and PA0. Indeed, especially the peak-to-peak approach is very likely strongly affected by statistical scatter due to the determination of the peak and by the steps in degree used for the construction of the curves. Therefore, the value of 18°, used for all clusters, might seem rather large, especially for those GCs (e.g., NGC 5139) for which a large number of line-of-sight velocities are available. For these reasons, we investigate the dependence of our results on the step chosen to demonstrate the robustness of our methods. This appendix shows the results obtained for the NGC 5139 cluster, which is the GC with the highest number of available stars, using the same methods adopted in our analysis and described in Section 3, but with a step of 9°. The signature of systemic rotation using a step of 9° for this cluster is shown in Figure C.1, while the Arot and PA0 obtained using this step and the comparison with the results obtained with a step of 18° is shown in the Table C.1. As a result, the use of these two different steps gives equivalent values of Arot and PA0. Therefore, the use of a step of 18° for all the clusters is a reasonable choice. Indeed, it allows us to consider a significant number of stars for each range in the case of clusters with a low number of available stars. Conversely, in the case of GCs with a high number of available stars, the use of this step does not show a significant difference in the results.
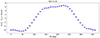 |
Fig. C.1. Difference between the mean radial velocities of the stars located on each side of the cluster with respect to a line passing through the center as a function of PA (measured from north, PA = 0°, to east, PA = 90°, with a step of 9°, clockwise system) for the globular cluster NGC 5139. The orange dashed line is the sine function that best fits the observed patterns (blue dots). |
Comparison of the results obtained using a step of 18° and of 9° for the globular cluster NGC 5139.
Appendix D: GCs with signature of systemic rotation
This appendix reports the difference between the mean radial velocities of the stars located on each side of the cluster with respect to a line passing through the center as a function of PA (measured from north, PA = 0°, to east, PA = 90°, with a step of 18°, clockwise system) for the GCs that show signature of systemic rotation. The orange dashed line is the sine function that best fits the observed patterns (blue dots).
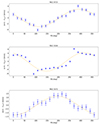 |
Fig. D.1. Signature of systemic rotation for GCs: NGC 6715, NGC 0104, NGC 5272, NGC 6656, NGC 3201, NGC 5904, NGC 6121, NGC 2808, NGC 6205, NGC 6752, NGC 6397, NGC 7078, NGC 0362, NGC 1851, NGC 6171, NGC 6254, NGC 6273, NGC 6341, NGC 6809, and NGC 6388 (from the top to the bottom). |
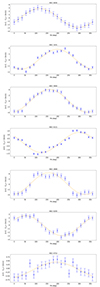 |
Fig. D.1. continued. |
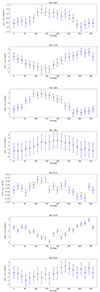 |
Fig. D.1. continued. |
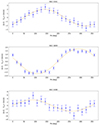 |
Fig. D.1. continued. |
Appendix E: Comparison with the literature
This appendix reports the comparative table between the latest values results available in the literature and our results for all GCs.
Comparison with literature values.
All Tables
Comparison of the results obtained using a step of 18° and of 9° for the globular cluster NGC 5139.
All Figures
|
Fig. 1. Distribution of the observed sample on the plane of the sky of NGC 5139, with x = (RA0 − RA) ⋅ cos(Dec) and y = Dec − Dec0 (RA0 and Dec0 being the coordinates of the cluster center, adopted from Vasiliev & Baumgardt 2021 catalog). The colors distinguish stars with radial velocities referred to the cluster systemic velocity ( |
| In the text | |
|
Fig. 2. Difference between the mean radial velocities of the stars located on each side of the cluster with respect to a line passing through the center as a function of PA (measured from north, PA = 0°, to east, PA = 90°, with a step of 18°, clockwise system) for the globular cluster NGC 5139. The orange dashed line is the sine function that best fits the observed patterns (blue dots). |
| In the text | |
|
Fig. 3. Comparisons of rotation amplitude values obtained from the sinusoidal best-fit function and the peak-to-peak approach. The black dots are the values of the rotation amplitude for each GCs, while the red line is the best-fit line obtained from the linear regression. |
| In the text | |
|
Fig. B.1. Difference between the mean radial velocities of the stars located on each side of the cluster with respect to a line passing through the center as a function of PA (measured from north, PA = 0°, to east, PA = 90°, with a step of 18°, clockwise system) for the globular clusters NGC 6218 (top) and NGC 6838 (bottom). |
| In the text | |
|
Fig. C.1. Difference between the mean radial velocities of the stars located on each side of the cluster with respect to a line passing through the center as a function of PA (measured from north, PA = 0°, to east, PA = 90°, with a step of 9°, clockwise system) for the globular cluster NGC 5139. The orange dashed line is the sine function that best fits the observed patterns (blue dots). |
| In the text | |
|
Fig. D.1. Signature of systemic rotation for GCs: NGC 6715, NGC 0104, NGC 5272, NGC 6656, NGC 3201, NGC 5904, NGC 6121, NGC 2808, NGC 6205, NGC 6752, NGC 6397, NGC 7078, NGC 0362, NGC 1851, NGC 6171, NGC 6254, NGC 6273, NGC 6341, NGC 6809, and NGC 6388 (from the top to the bottom). |
| In the text | |
|
Fig. D.1. continued. |
| In the text | |
|
Fig. D.1. continued. |
| In the text | |
|
Fig. D.1. continued. |
| In the text | |
Current usage metrics show cumulative count of Article Views (full-text article views including HTML views, PDF and ePub downloads, according to the available data) and Abstracts Views on Vision4Press platform.
Data correspond to usage on the plateform after 2015. The current usage metrics is available 48-96 hours after online publication and is updated daily on week days.
Initial download of the metrics may take a while.