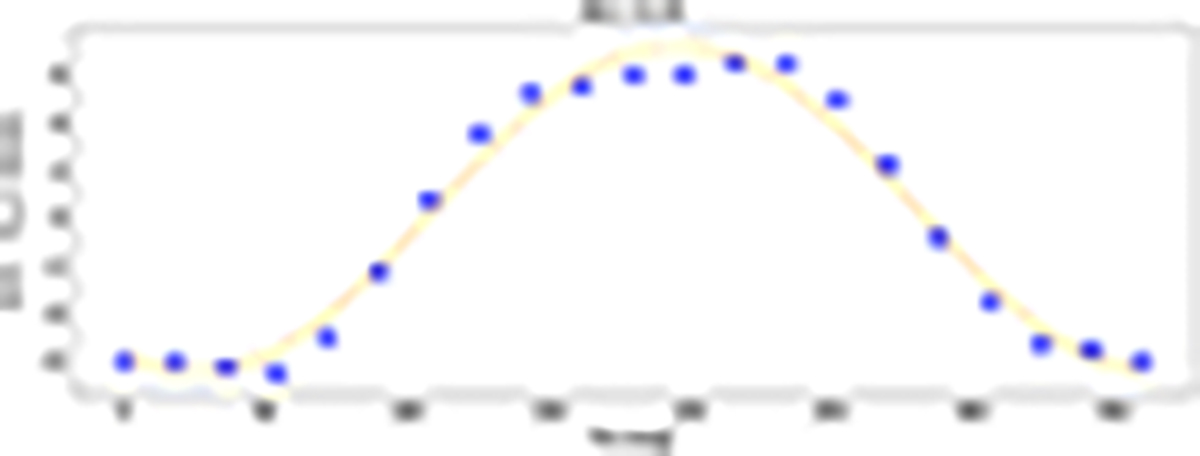
Fig. 2.
Download original image
Difference between the mean radial velocities of the stars located on each side of the cluster with respect to a line passing through the center as a function of PA (measured from north, PA = 0°, to east, PA = 90°, with a step of 18°, clockwise system) for the globular cluster NGC 5139. The orange dashed line is the sine function that best fits the observed patterns (blue dots).
Current usage metrics show cumulative count of Article Views (full-text article views including HTML views, PDF and ePub downloads, according to the available data) and Abstracts Views on Vision4Press platform.
Data correspond to usage on the plateform after 2015. The current usage metrics is available 48-96 hours after online publication and is updated daily on week days.
Initial download of the metrics may take a while.