Fig. 4
Download original image
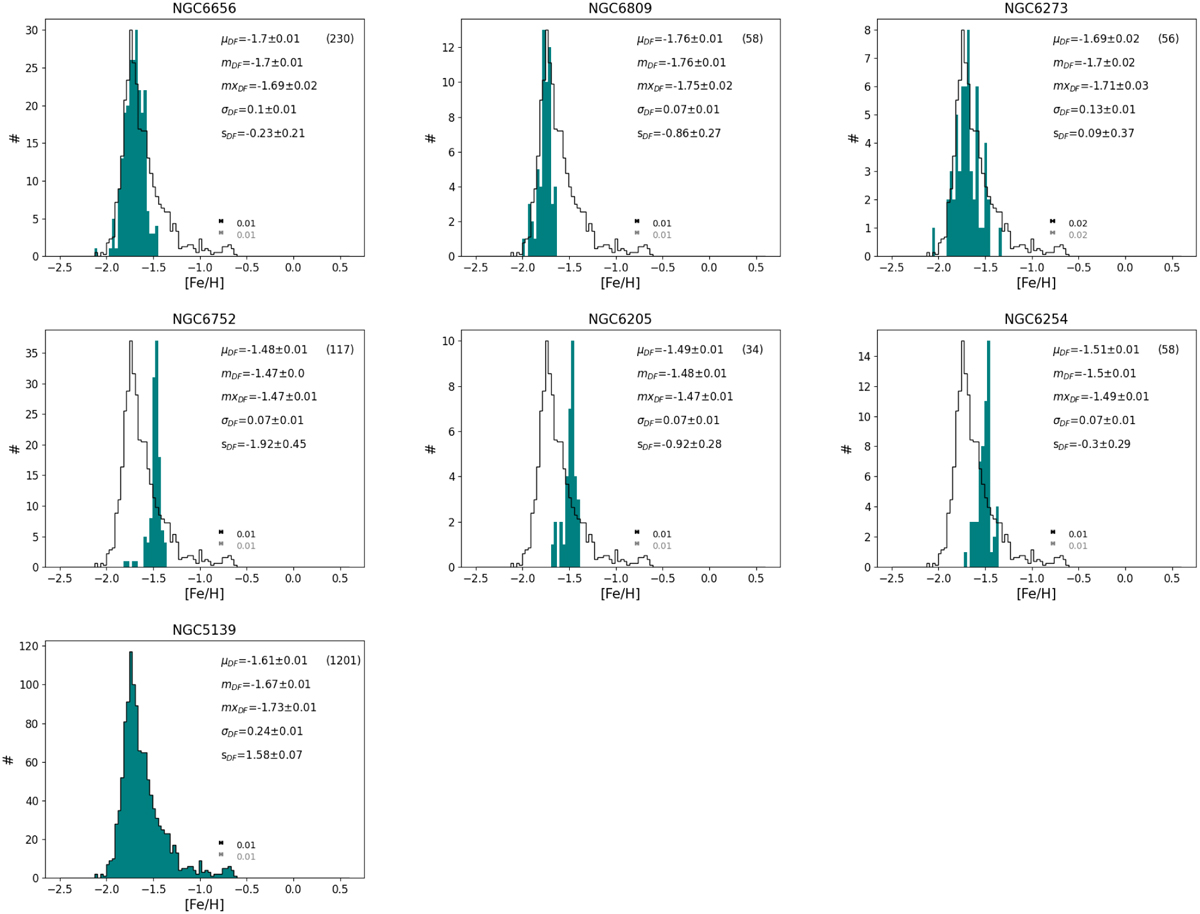
[Fe/H] distribution of the Galactic globular clusters NGC 6656, NGC 6809, NGC 6273 (the metal-poor clusters, first row), NGC 6752, NGC 6205, and NGC 6254 (the metal-rich clusters, second row), which – according to our analysis – are chemically compatible with ω Cen. For each cluster, the values of the mean, median, mode, dispersion, and skewness of the distribution, and their relative uncertainties, are also reported. The horizontal black and grey error bars at the bottom of each plot show the median and mean uncertainties in [Fe/H], respectively, derived from the Schiavon et al. (2024) catalogue. In each plot, the value reported in parenthesis gives the number of stars used to trace the histogram. For comparison, in each plot, the [Fe/H] distribution of ω Cen (NGC 5139) is also reported (black step-like histogram). The latter has been normalised in such a way that the maximum value coincides with the maximum of the [Fe/H] distribution of the cluster to which it is compared (hence the normalisation varies from plot to plot). The absolute [Fe/H] distribution of ω Cen (i.e. without the normalisation of the peak value) is reported in the last row, with the corresponding mean, median, mode, dispersion, and skewness of its distribution.
Current usage metrics show cumulative count of Article Views (full-text article views including HTML views, PDF and ePub downloads, according to the available data) and Abstracts Views on Vision4Press platform.
Data correspond to usage on the plateform after 2015. The current usage metrics is available 48-96 hours after online publication and is updated daily on week days.
Initial download of the metrics may take a while.