Open Access
Fig. 9
Download original image
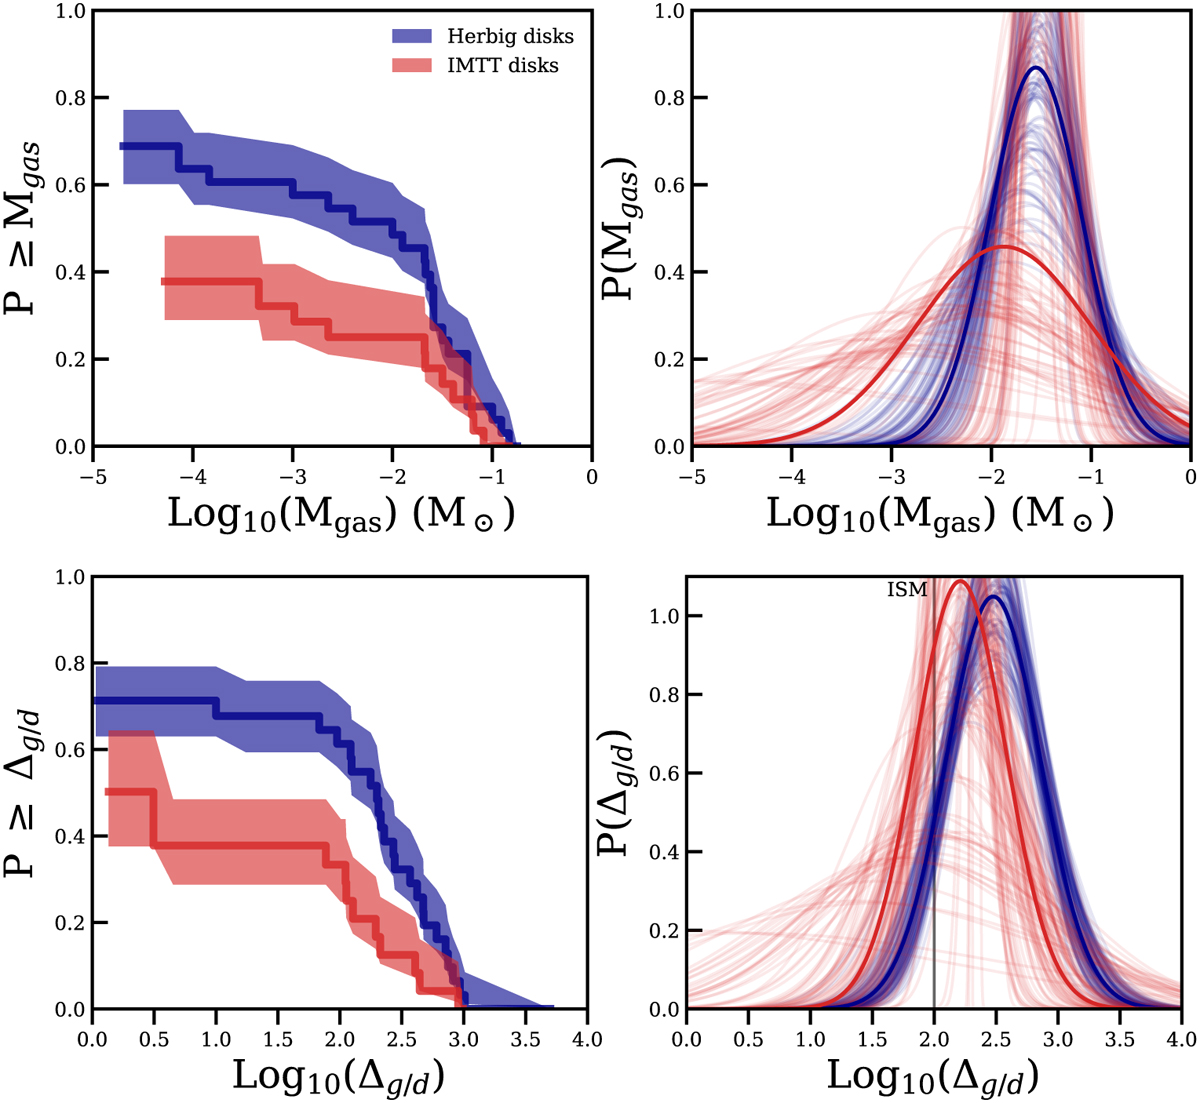
Resulting gas masses obtained from the models of S24 are shown in the top row. The Herbig disks are shown in blue, while the distribution of the IMTT disks is shown in red. Combining the gas distributions with the dust mass distributions in Fig. 6 gives the gas-to-dust ratio distributions shown in the bottom row.
Current usage metrics show cumulative count of Article Views (full-text article views including HTML views, PDF and ePub downloads, according to the available data) and Abstracts Views on Vision4Press platform.
Data correspond to usage on the plateform after 2015. The current usage metrics is available 48-96 hours after online publication and is updated daily on week days.
Initial download of the metrics may take a while.