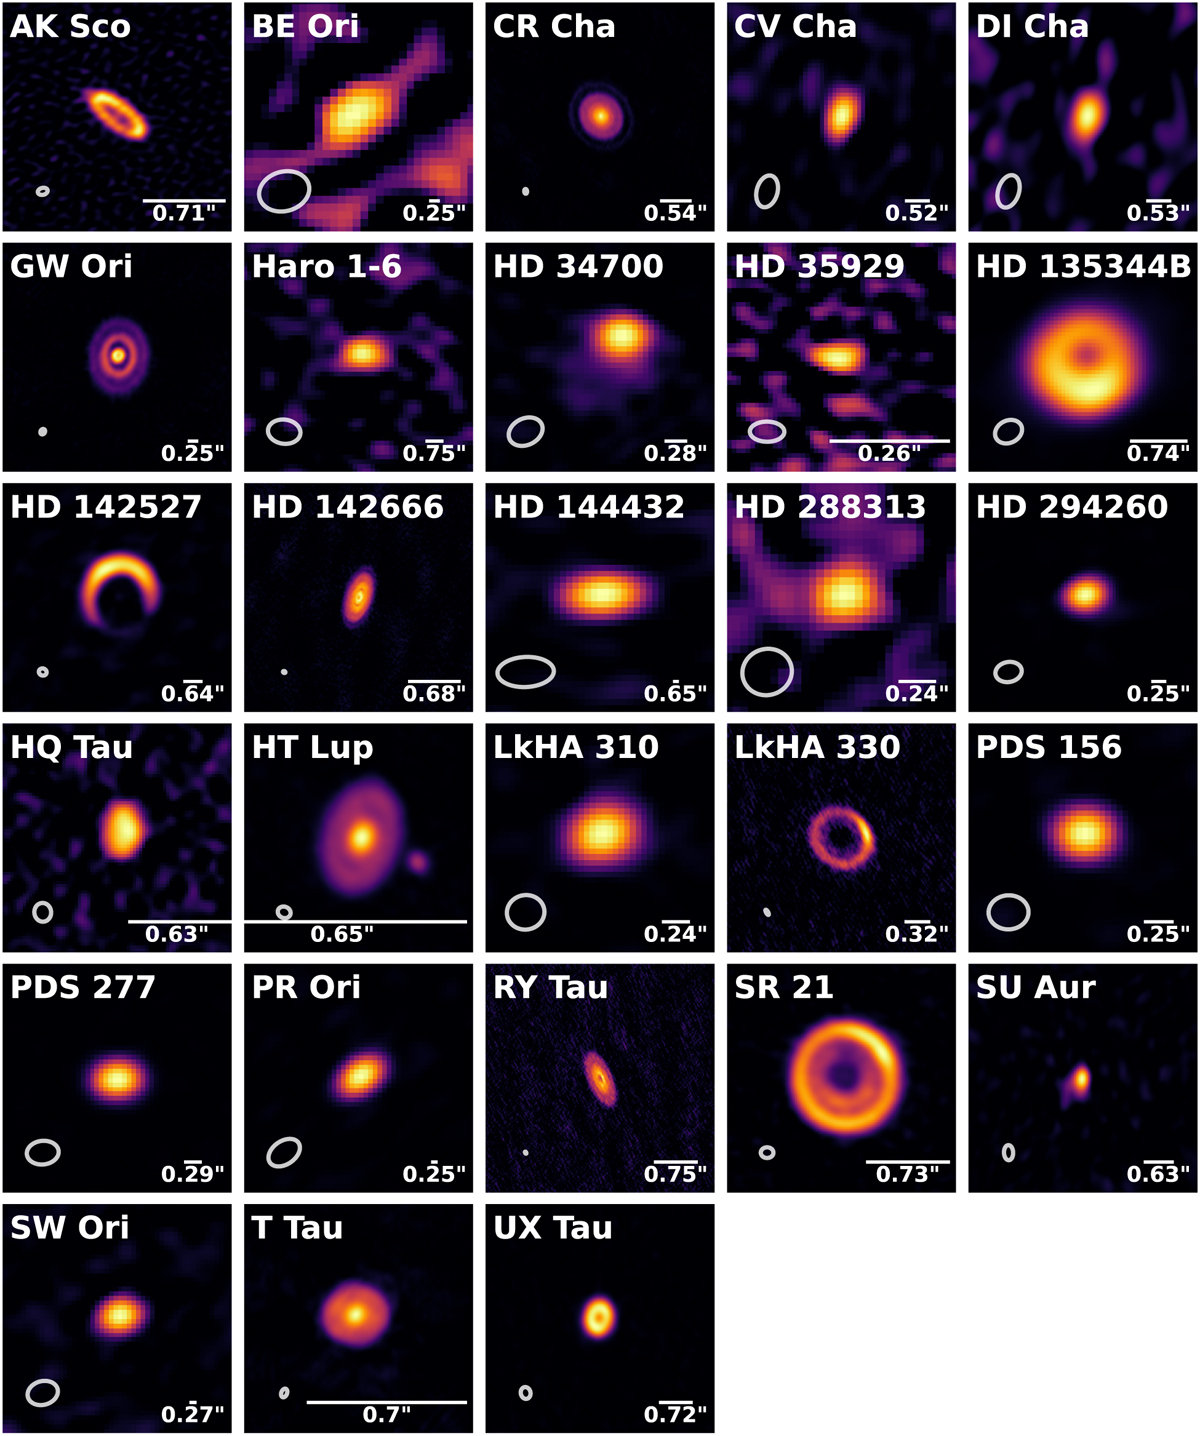
Fig. 4
Download original image
Continuum images of intermediate-mass T Tauri disks with a detection, using a sinh stretch. The size of the image is indicated by the bar of size 100 au on the bottom right of each panel with the corresponding angular size. The beam size is shown as the ellipse on the bottom left of each panel. The group classification can be found in Table A.1.
Current usage metrics show cumulative count of Article Views (full-text article views including HTML views, PDF and ePub downloads, according to the available data) and Abstracts Views on Vision4Press platform.
Data correspond to usage on the plateform after 2015. The current usage metrics is available 48-96 hours after online publication and is updated daily on week days.
Initial download of the metrics may take a while.