Fig. 10
Download original image
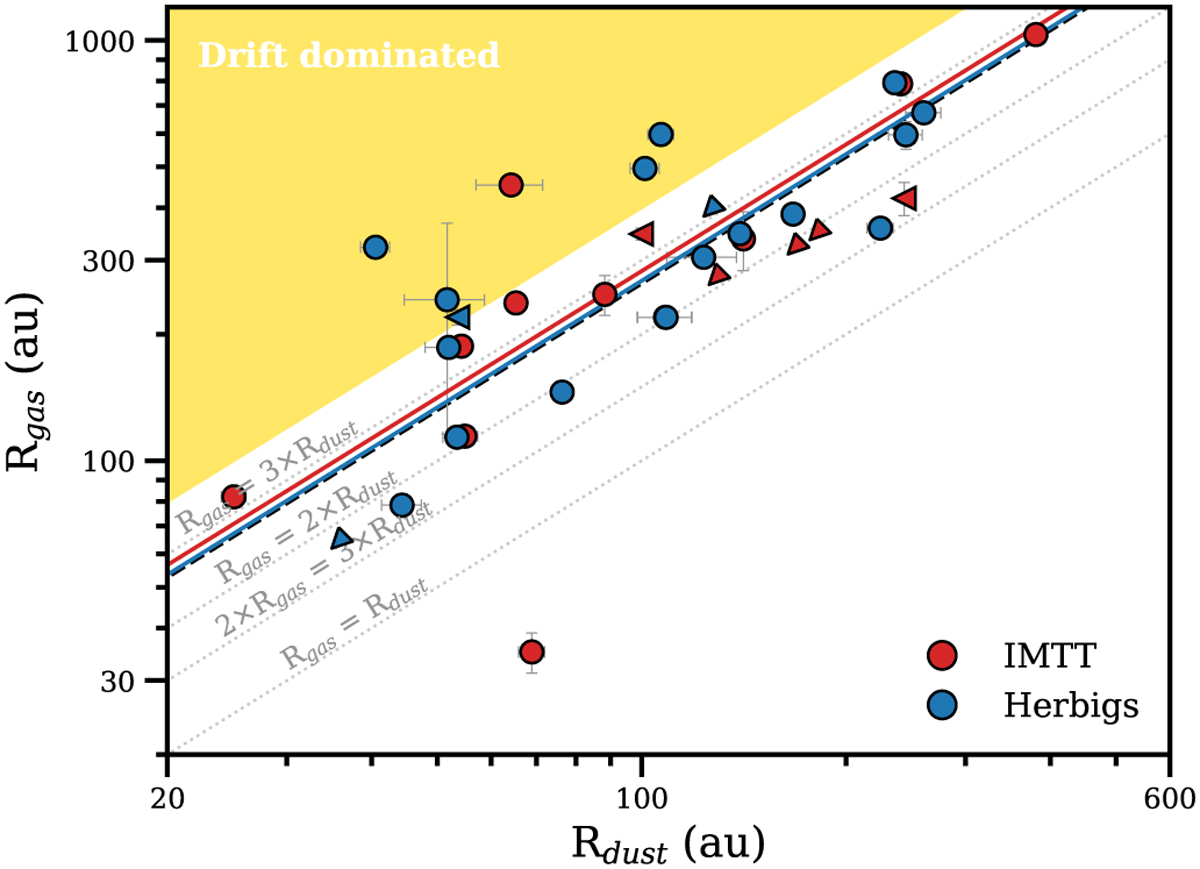
Dust and gas 90% radii of the IMTT disks (red) and Herbig disks (blue). The fitted relation between the two parameters is shown as the solid lines. The relationship is the same for both Herbig and IMTT disks. In yellow the region is shown where the difference between the dust and gas radii cannot be explained by optical depth effects only (Trapman et al. 2019). The dashed black line is a fit through the IMTT disks excluding SR 21, GW Ori, HT Lup, and SU Aur, as these have extended emission beyond the disk.
Current usage metrics show cumulative count of Article Views (full-text article views including HTML views, PDF and ePub downloads, according to the available data) and Abstracts Views on Vision4Press platform.
Data correspond to usage on the plateform after 2015. The current usage metrics is available 48-96 hours after online publication and is updated daily on week days.
Initial download of the metrics may take a while.