Open Access
Fig. 1.
Download original image
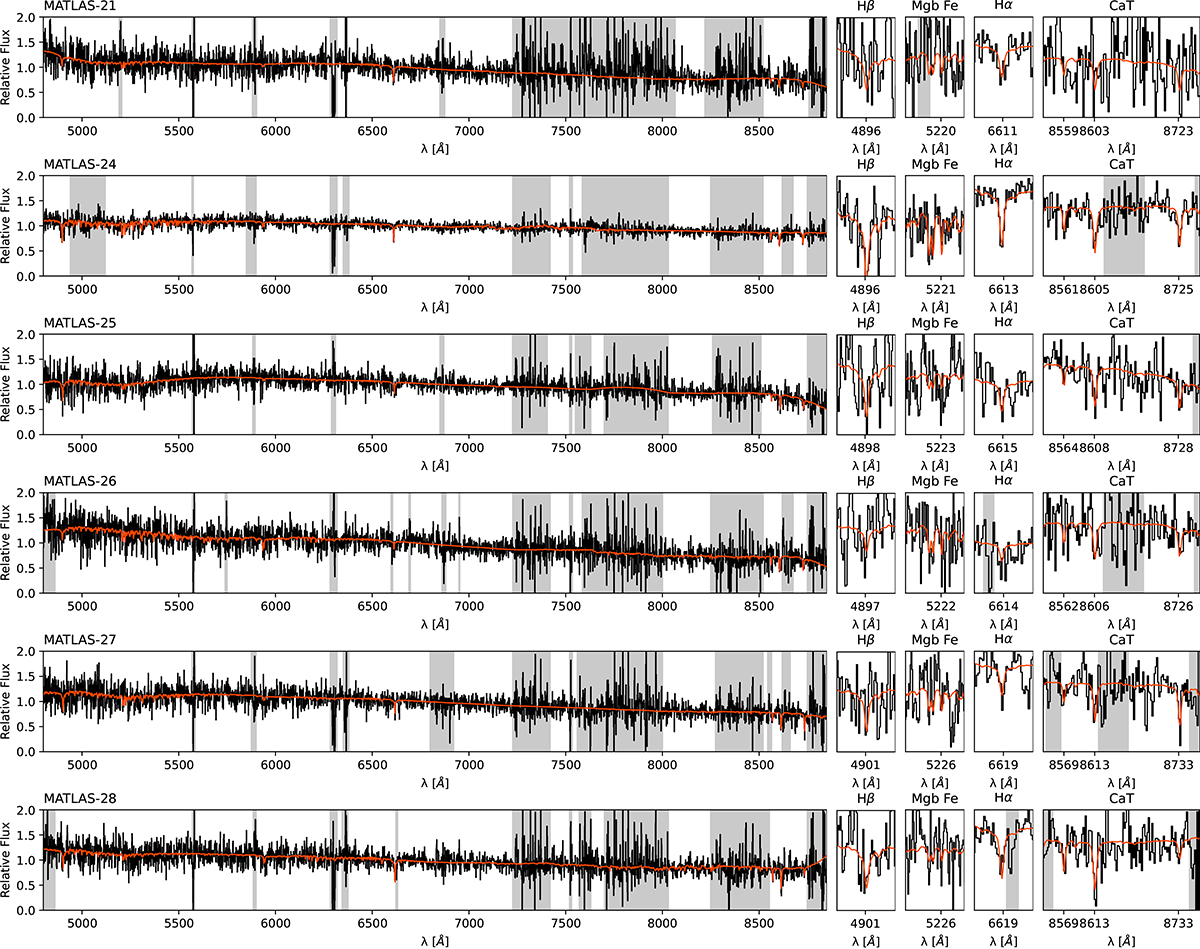
Spectra of the confirmed dwarf galaxies in the field around NGC 474. The spectra (black line) and the best fit from pPXF (red line) is plotted in the left panel over the full spectral coverage of MUSE. The gray areas indicate masked regions. The right panels highlight features of interest that were relevant for the fitting.
Current usage metrics show cumulative count of Article Views (full-text article views including HTML views, PDF and ePub downloads, according to the available data) and Abstracts Views on Vision4Press platform.
Data correspond to usage on the plateform after 2015. The current usage metrics is available 48-96 hours after online publication and is updated daily on week days.
Initial download of the metrics may take a while.