Open Access
Fig. 5.
Download original image
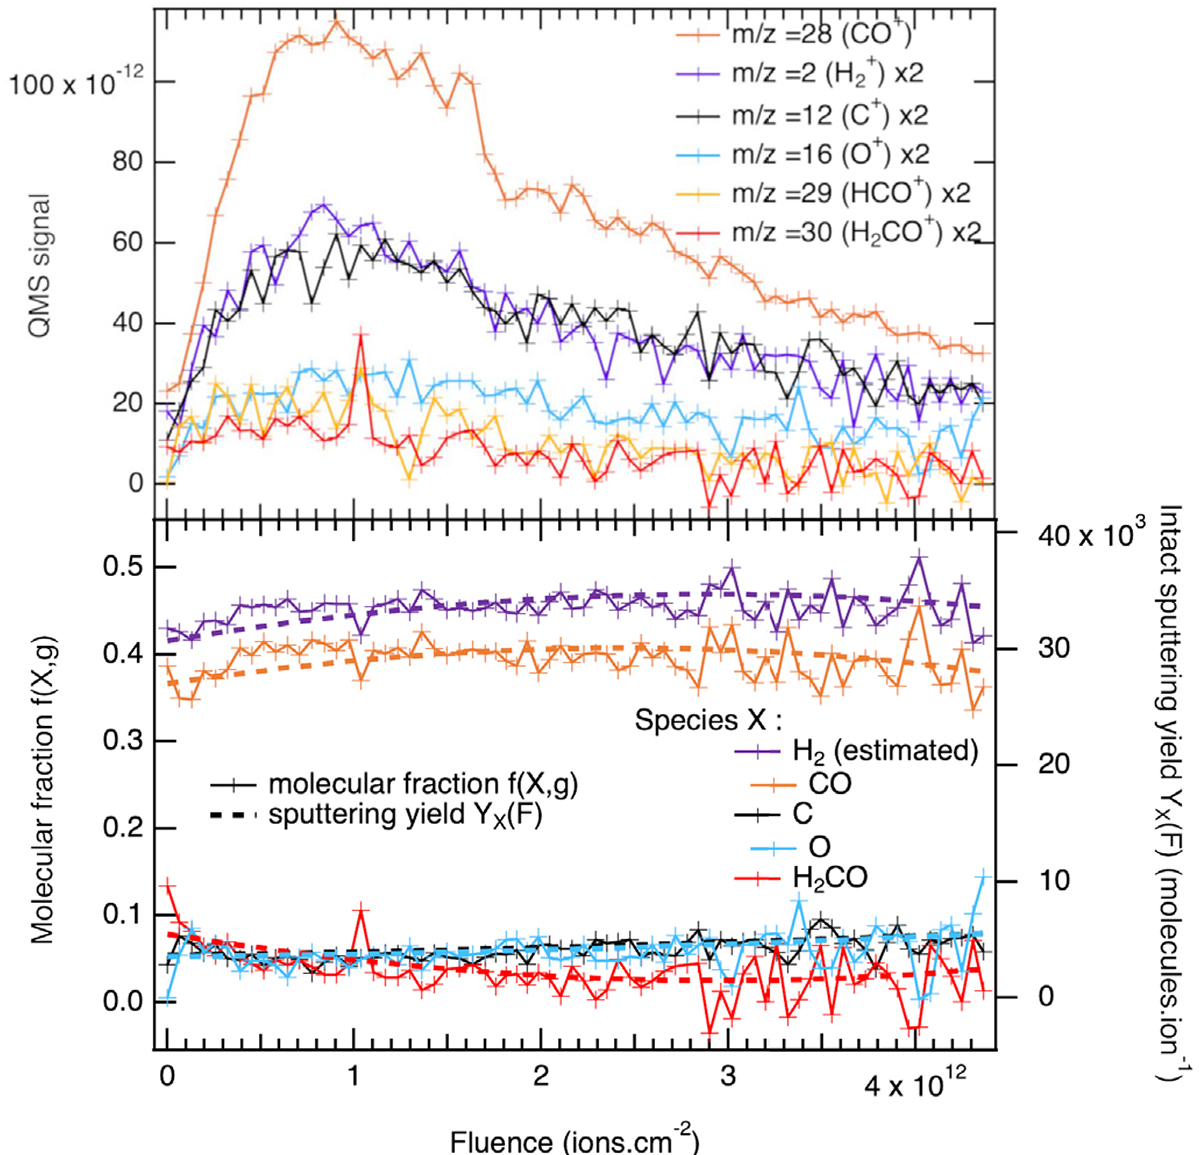
QMS signals as a function of fluence. Top panel: Background corrected signals. Bottom panel: Molecular fractions in the gas (solid lines, left y-axis) derived from the fragmentation patterns and ionisation cross sections, and sputtering yield of each species (dashed lines, right y-axis). See text for details.
Current usage metrics show cumulative count of Article Views (full-text article views including HTML views, PDF and ePub downloads, according to the available data) and Abstracts Views on Vision4Press platform.
Data correspond to usage on the plateform after 2015. The current usage metrics is available 48-96 hours after online publication and is updated daily on week days.
Initial download of the metrics may take a while.