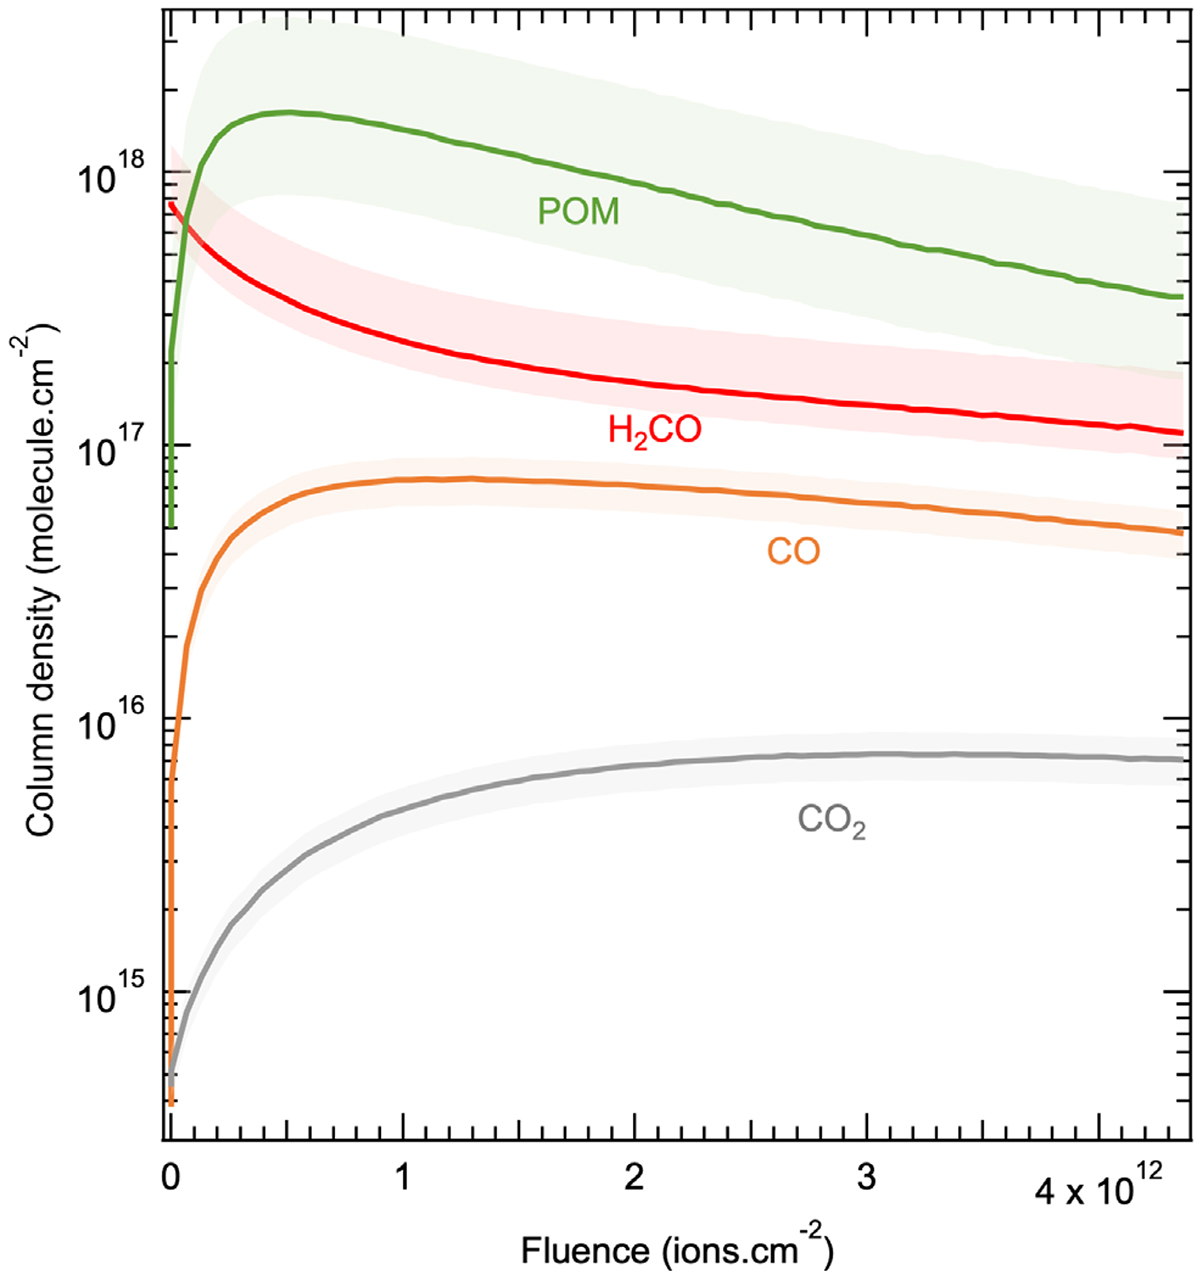
Fig. 2.
Download original image
Column density evolution of CO2, CO, H2CO, and POM ices as a function of fluence. In the case of POM, a factor of 2 uncertainty was assumed for the band strength of the combination mode at 1105 cm−1 (see text), as depicted by the shaded green zone. In the case of H2CO, the band strength of the stretching mode at 1725 cm−1 was also evaluated by Schutte et al. (1993) as 9.6×10⁻¹⁸ cm molecules−1 at 10 K, which corresponds to the highest column density value of the shaded red zone. Otherwise, an uncertainty of 20% was assumed for the band strengths.
Current usage metrics show cumulative count of Article Views (full-text article views including HTML views, PDF and ePub downloads, according to the available data) and Abstracts Views on Vision4Press platform.
Data correspond to usage on the plateform after 2015. The current usage metrics is available 48-96 hours after online publication and is updated daily on week days.
Initial download of the metrics may take a while.