Fig. 4.
Download original image
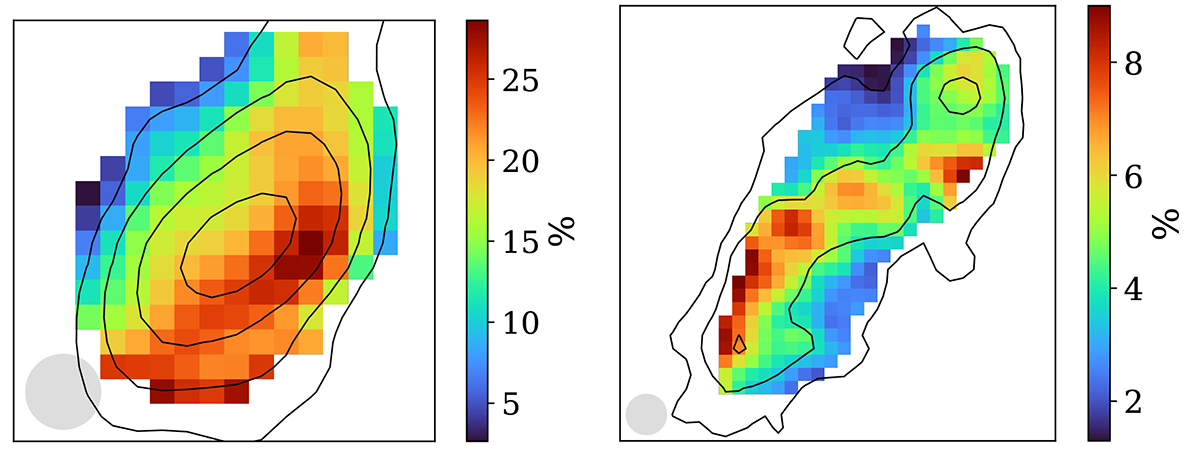
Maps of the CO fraction defined as the ratio of the CO(2−1) line emission to the observed 1.15 mm emission in NGC 2146 (left) and NGC 2976 (right) at 18″ angular resolution. Only pixels above the 3σrms level of the observed NIKA2 map are shown. Contours show the intensity of CO emission in each galaxy, starting from 1σrms and increasing by factors of 3. The circles in the bottom left corners indicate the beam area.
Current usage metrics show cumulative count of Article Views (full-text article views including HTML views, PDF and ePub downloads, according to the available data) and Abstracts Views on Vision4Press platform.
Data correspond to usage on the plateform after 2015. The current usage metrics is available 48-96 hours after online publication and is updated daily on week days.
Initial download of the metrics may take a while.