Fig. 3.
Download original image
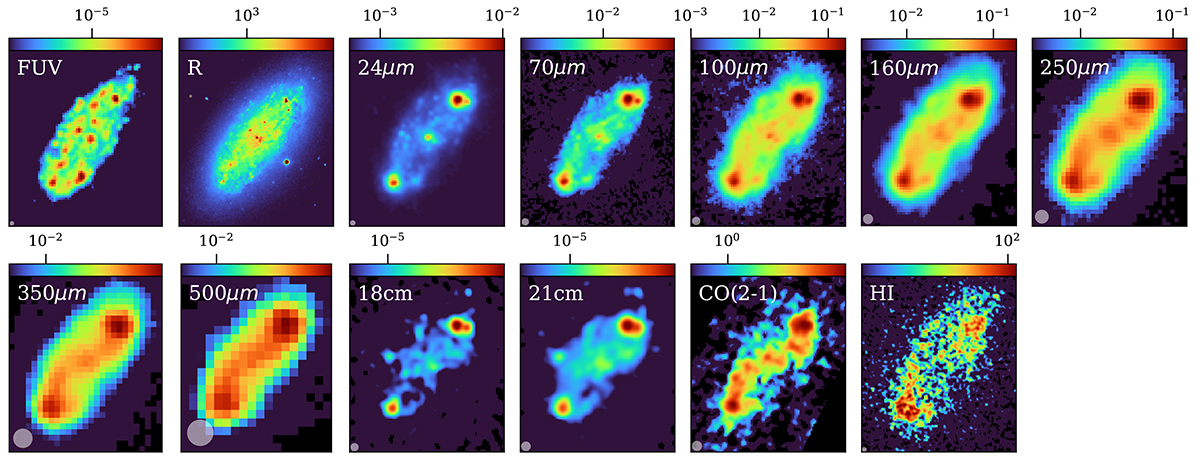
Same as Fig. 2, but for NGC 2976. The HI map, which is only available for this galaxy, is also included. The optical map in the Red filter displays the optical features of this galaxy and is not used in the analysis. The Planck 1.38 mm and radio 6.2 cm maps are also not shown due to poor resolution. All the demonstrated maps have the same FoV of 3.7′×4.2′ centered on the galaxy. The maps are all shown in logarithmic scale and at their original resolution (see Table 2); the beam size is represented by a white circle in the bottom left corner of each map.
Current usage metrics show cumulative count of Article Views (full-text article views including HTML views, PDF and ePub downloads, according to the available data) and Abstracts Views on Vision4Press platform.
Data correspond to usage on the plateform after 2015. The current usage metrics is available 48-96 hours after online publication and is updated daily on week days.
Initial download of the metrics may take a while.