Fig. A.1.
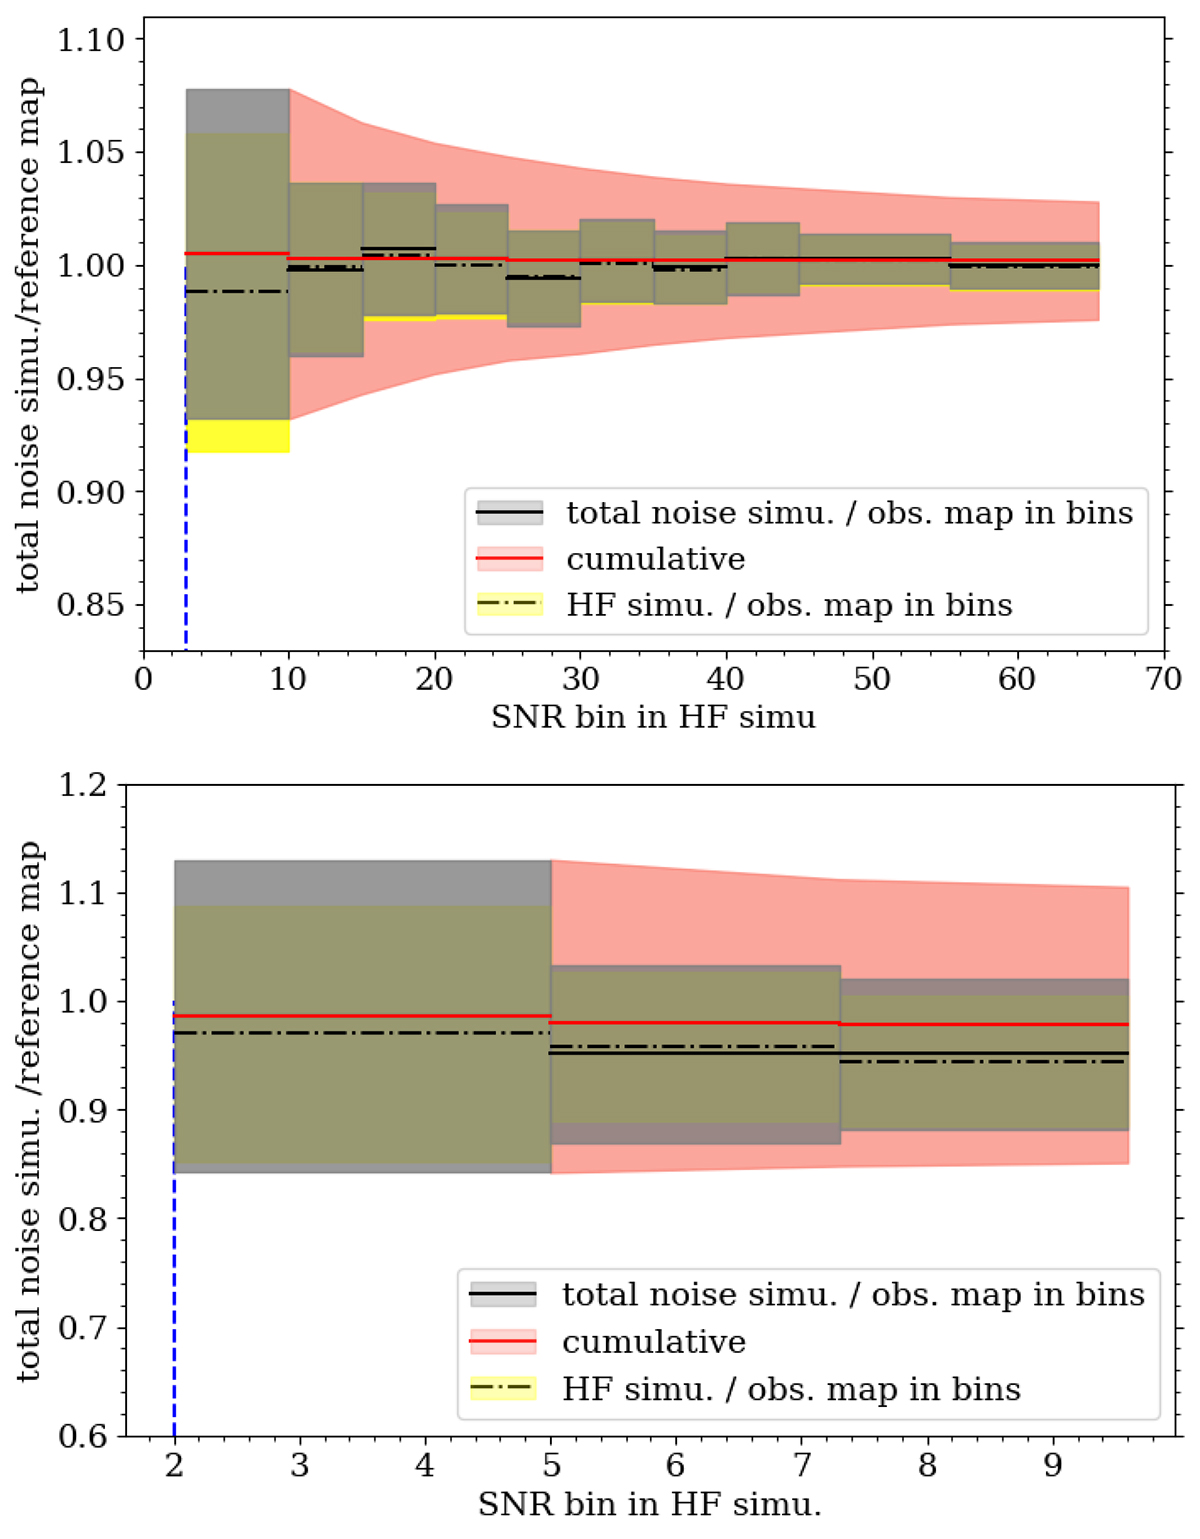
Download original image
Transfer functions at 250 μm (with a FWHM of 18″) binned as a function of signal-to-noise ratio (S/N) where the noise standard deviation σHF is from a simulation including only white and high-frequency noise. The red curve and red shaded area show the cumulative fraction of the flux that is recovered and the associated uncertainties, from the lower S/N limit (3σHF for NGC 2146 and 2σHF for NGC 2976) up to the maximum of the current S/N bin.
Current usage metrics show cumulative count of Article Views (full-text article views including HTML views, PDF and ePub downloads, according to the available data) and Abstracts Views on Vision4Press platform.
Data correspond to usage on the plateform after 2015. The current usage metrics is available 48-96 hours after online publication and is updated daily on week days.
Initial download of the metrics may take a while.