Fig. 11.
Download original image
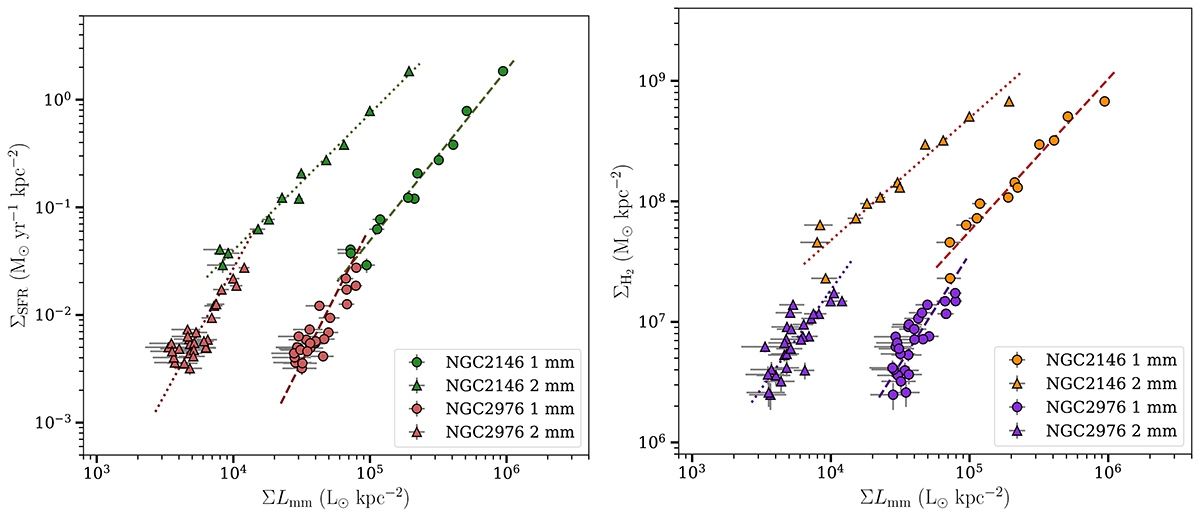
Relation of millimeter emission with SFR and H2. Left: Correlations between the surface densities of the SFR (ΣSFR) and the observed millimeter luminosity (ΣLmm) at 1.15 mm (circles) and 2 mm (triangles) in NGC 2146 (green) and NGC 2976 (red). The lines show the OLS-bisector fits (see Table 8). Right: Same as the left, but for the surface density of molecular gas (ΣH2) as the Y-axis. The maps are smoothed to one pixel per 18″ beam width to prevent internal correlation between pixels. The error bars indicate 1σrms noise of each map, and when not shown, it means that they are smaller than the symbol size.
Current usage metrics show cumulative count of Article Views (full-text article views including HTML views, PDF and ePub downloads, according to the available data) and Abstracts Views on Vision4Press platform.
Data correspond to usage on the plateform after 2015. The current usage metrics is available 48-96 hours after online publication and is updated daily on week days.
Initial download of the metrics may take a while.