Fig. 9

Download original image
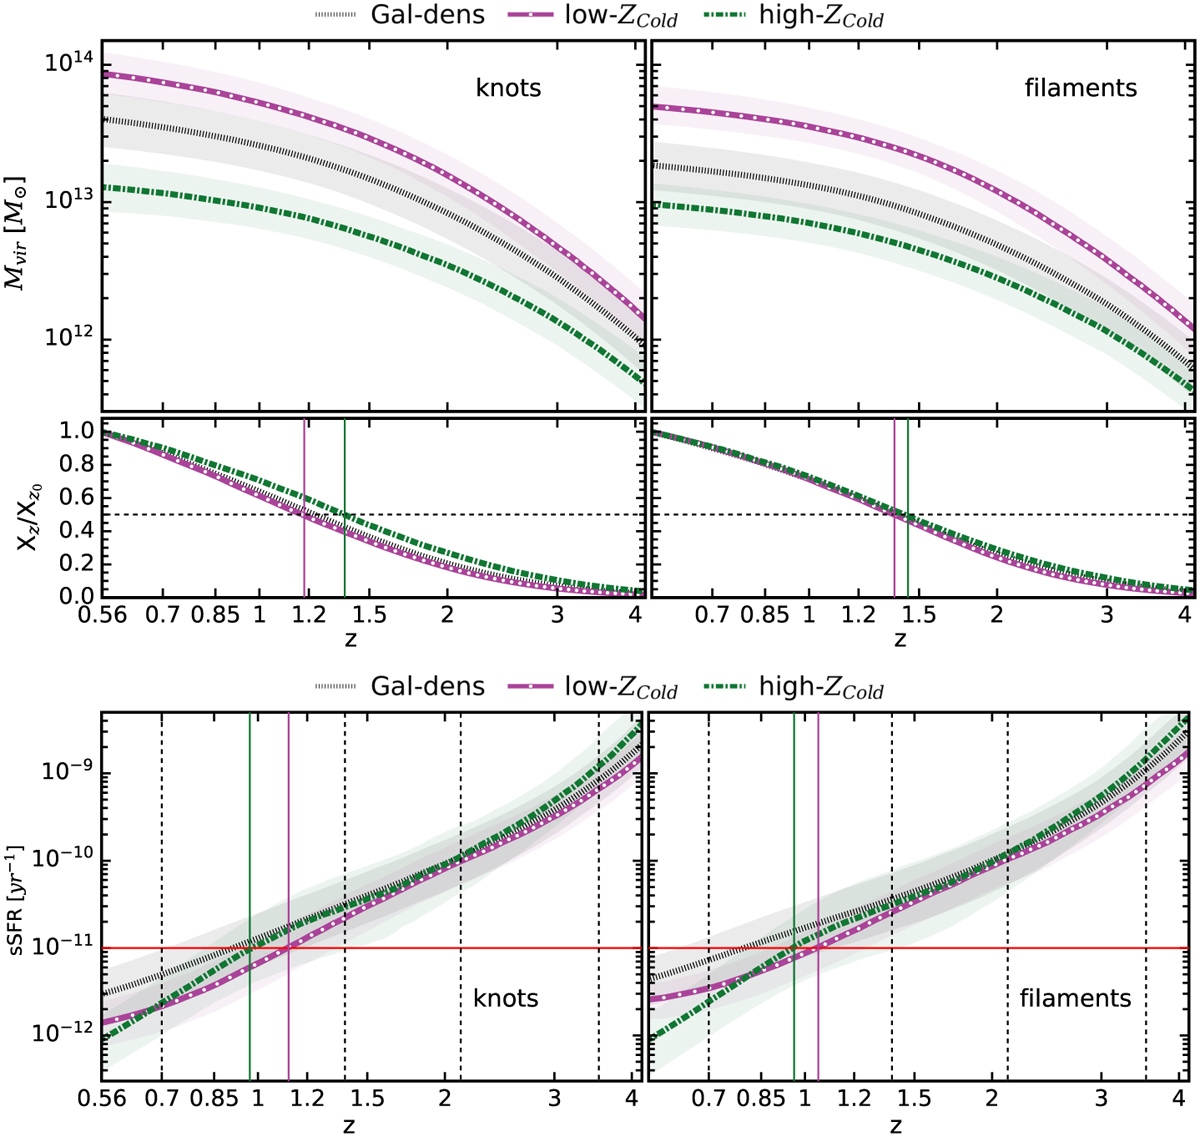
Redshift evolution: in the upper figure, we present the redshift evolution or the median values of halo mass, Mvir , (upper panels) and the corresponding mass growth history, relative to the reference redshift of our study, zref = 0.56, (lower panels). Meanwhile, the lower figure illustrates the evolution of the specific star formation rate, sSFR. In both figures, the left panels display the evolution for knot environments, while the right panels show the corresponding evolution for filament environments. We include the parent sample, Gal-dens (short-dashed black line), alongside the low-Zcold (solid magenta line with white dots) and high-Zcold (dashed-dotted green line) sub-samples. The shaded regions represent the range between the 32nd and 68th percentiles around the median. In the upper figure, vertical solid lines mark the redshift at which 50% of the halo mass was assembled, known as the half-mass assembly time. In the lower figure, vertical solid lines indicate the redshifts where the low-Zcold (magenta) and high-Zcold (green) galaxies drop below the classic star formation/quenching threshold, sSFR ∼ 10−11 yr−1, as marked by the horizontal red line (Franx et al. 2008). Thin vertical black dashed lines highlight the redshifts of prominent line features in (r-i) shown in panel b of Fig. 6.
Current usage metrics show cumulative count of Article Views (full-text article views including HTML views, PDF and ePub downloads, according to the available data) and Abstracts Views on Vision4Press platform.
Data correspond to usage on the plateform after 2015. The current usage metrics is available 48-96 hours after online publication and is updated daily on week days.
Initial download of the metrics may take a while.


