Fig. 8
Download original image
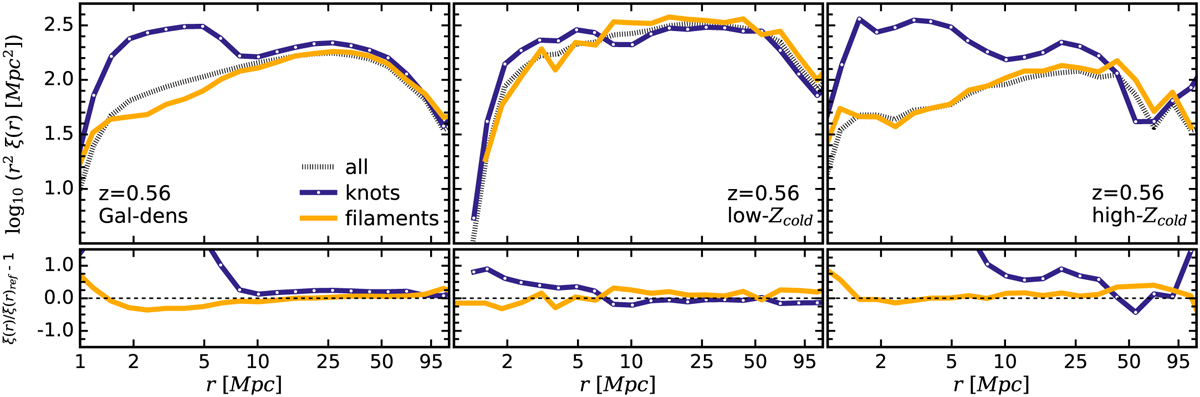
Galaxy clustering functions in different environments: in the upper panels, we show the real-space two-point correlation function, ξ(r), at z = 0.56 for galaxies in the parent sample, Gal-dens (left panel), and for sub-samples low-Zcold (middle panel) and high-Zcold (right panel). In each panel we show the clustering for all galaxies in the sample (dashed black line), knot galaxies (solid yellow line), and filament galaxies (solid blue line with white dots). In the lower panel, we present the fractional difference in the clustering function of the filament and knot populations (ξ(r)), respectively, with respect to the clustering of the entire sample (‘all’, ξ(r)ref).
Current usage metrics show cumulative count of Article Views (full-text article views including HTML views, PDF and ePub downloads, according to the available data) and Abstracts Views on Vision4Press platform.
Data correspond to usage on the plateform after 2015. The current usage metrics is available 48-96 hours after online publication and is updated daily on week days.
Initial download of the metrics may take a while.