Fig. 7
Download original image
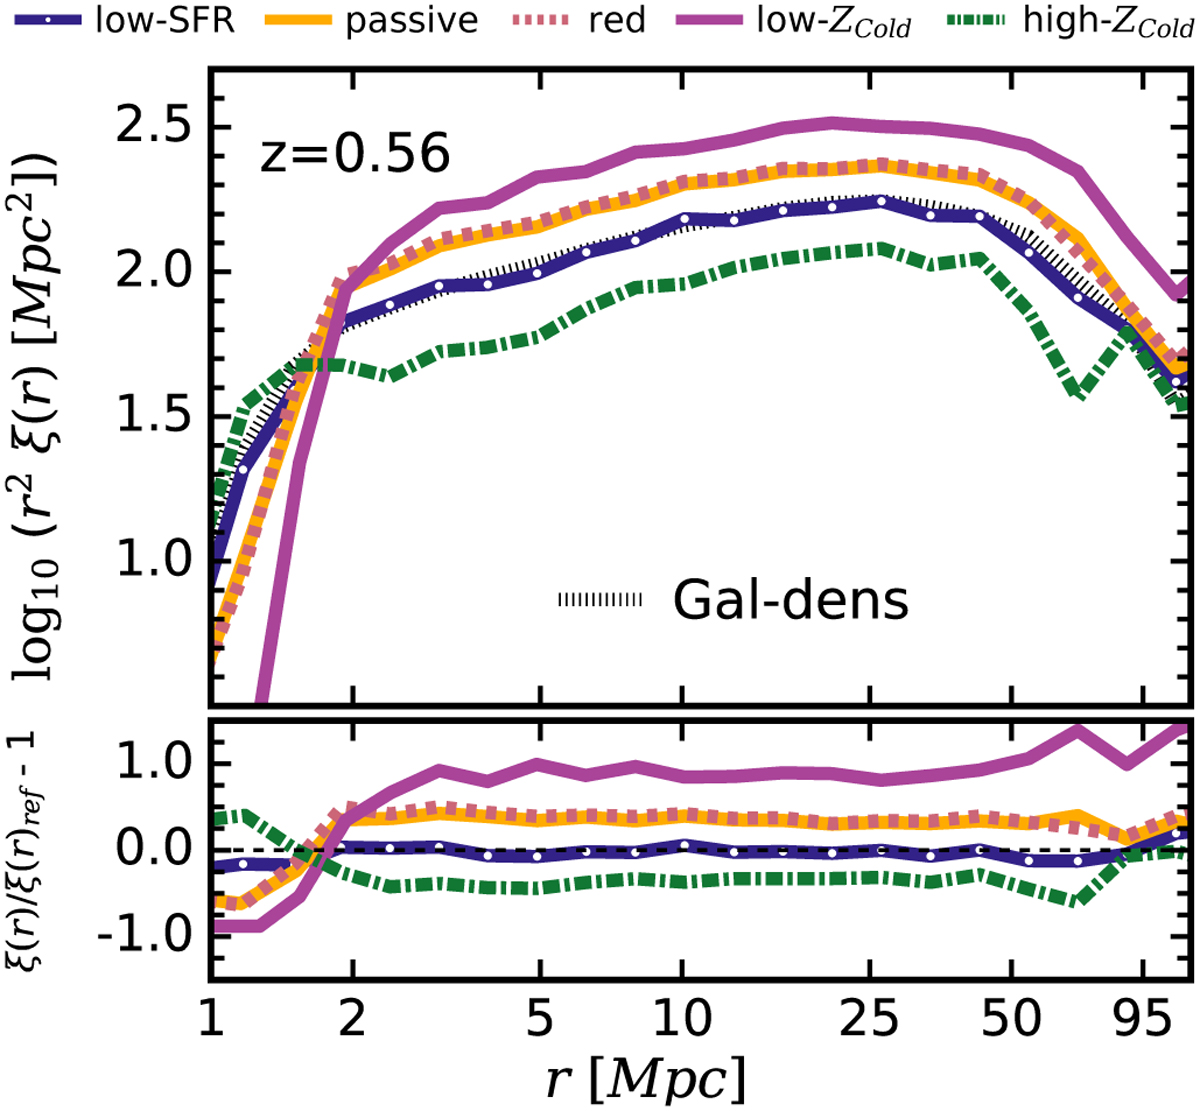
Galaxy clustering functions: in the upper panel, we show the real- space two-point correlation function, ξ(r), at redshift zref = 0.56 for all sub-samples (using their respective colour scheme and line style keys as in Fig. 3) and the parent sample of the SAM-CMASS mock galaxies, Gal-dens (short-dashed black line). In the lower panel we display the fractional difference between the clustering function of each sub-sample (ξ(r)) and that of Gal-dens (ξ(r)ref).
Current usage metrics show cumulative count of Article Views (full-text article views including HTML views, PDF and ePub downloads, according to the available data) and Abstracts Views on Vision4Press platform.
Data correspond to usage on the plateform after 2015. The current usage metrics is available 48-96 hours after online publication and is updated daily on week days.
Initial download of the metrics may take a while.