Fig. 3
Download original image
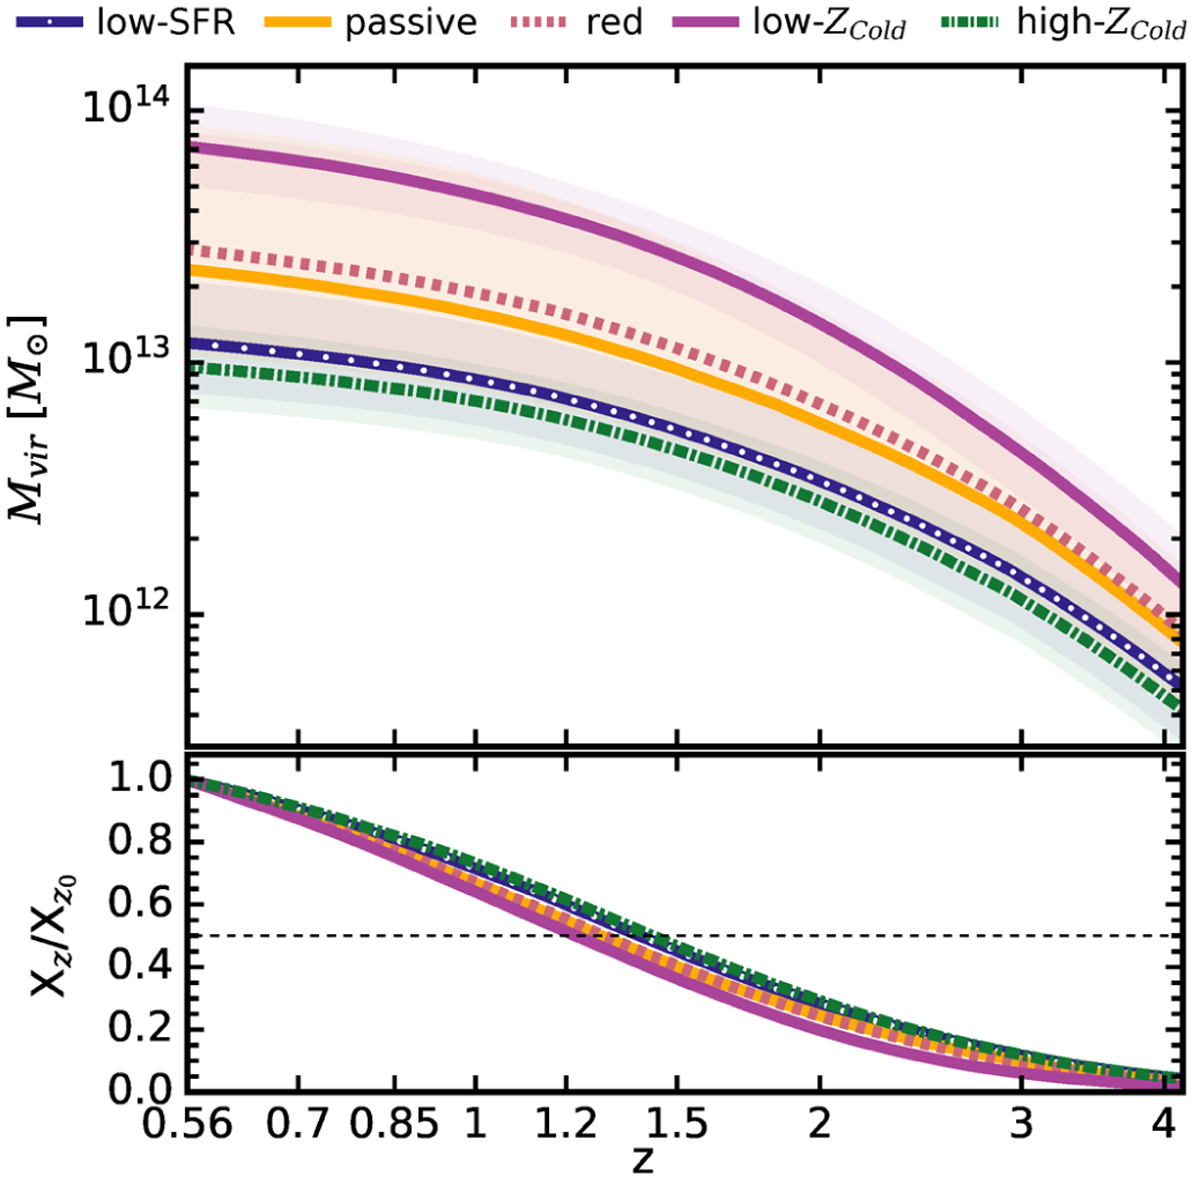
Halo mass assembly history: in the upper panel we show the redshift evolution of median values of the halo mass, Mvir , according to the selection procedure outlined in Fig. B.1 for our five selected sub-samples: low-SFR (solid blue line with white dots indicating the redshift values of each snapshot), passive (solid light yellow line), red (short-dashed red line), low-Zcold (solid dark magenta line), and high- Zcold (dotted-dashed green line). The shaded regions represent the range spanning between the 32nd and the 68th percentile around the median. Their corresponding mass growth history relative to the reference redshift of our study, zref = 0.56, as z0 . In this panel, Xz denotes the values of Mvir at a specific snapshot/redshift compared to the values at z0 (![]() ). The horizontal dashed black line indicates the threshold of 50% of the total halo mass at zref.
). The horizontal dashed black line indicates the threshold of 50% of the total halo mass at zref.
Current usage metrics show cumulative count of Article Views (full-text article views including HTML views, PDF and ePub downloads, according to the available data) and Abstracts Views on Vision4Press platform.
Data correspond to usage on the plateform after 2015. The current usage metrics is available 48-96 hours after online publication and is updated daily on week days.
Initial download of the metrics may take a while.