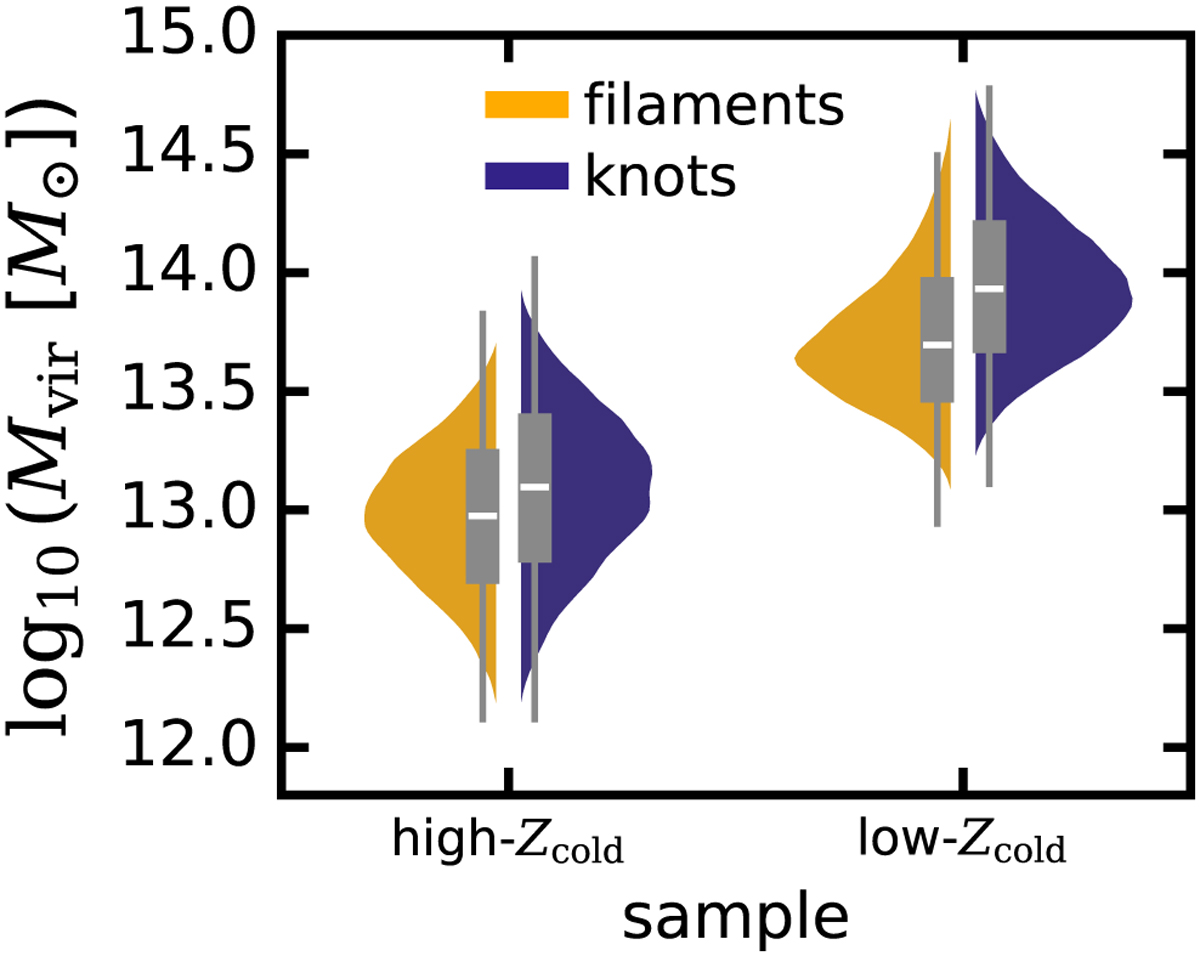
Fig. C.1
Download original image
Violin plot visualising the distribution of halo mass (Mvir) for the sample. The high-Zcold galaxies are shown on the left, and the low-Zcold galaxies are on the right. Each violin displays the distribution of filament and knot galaxies. The left side of each violin represents the filament galaxy distribution, while the right side shows the knot galaxy distribution. We have also overlayed box plots in grey, with the median values marked in white. This visual representation confirms the results of our KS test: filament and knot galaxies in the high-Zcold sub-sample are statistically closer, while filament and knot galaxies in the low-Zcold exhibit greater differences.
Current usage metrics show cumulative count of Article Views (full-text article views including HTML views, PDF and ePub downloads, according to the available data) and Abstracts Views on Vision4Press platform.
Data correspond to usage on the plateform after 2015. The current usage metrics is available 48-96 hours after online publication and is updated daily on week days.
Initial download of the metrics may take a while.