Fig. 10
Download original image
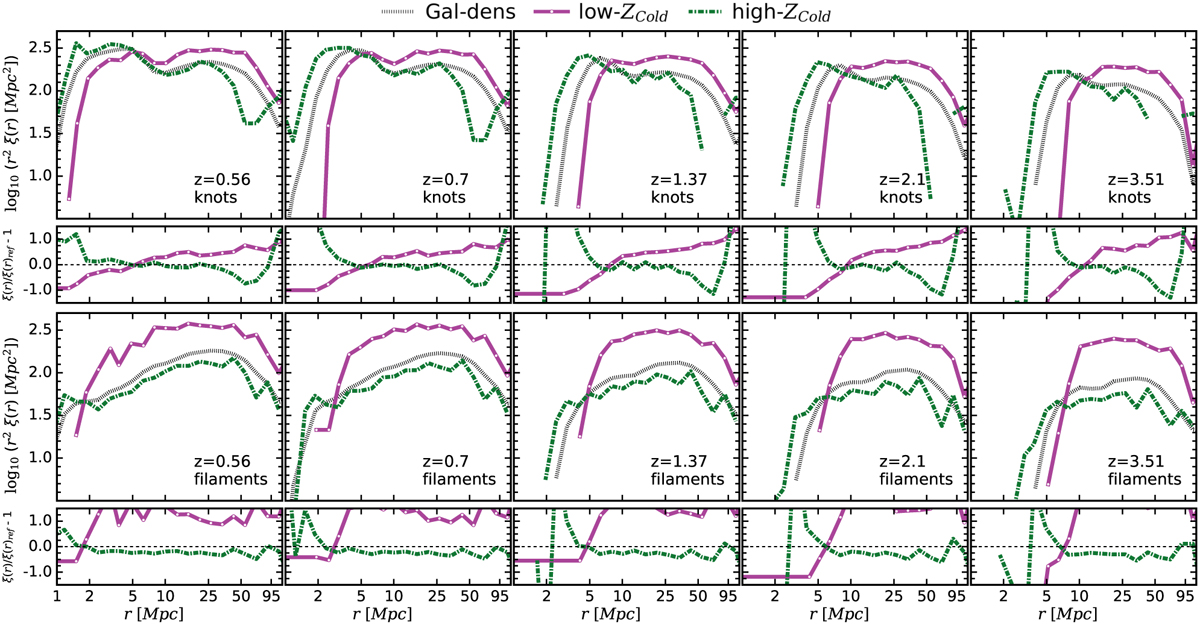
Redshift evolution of the real-space 2PCF, ξ(r), for the selected sub-samples: Gal-dens, low-Zcold and high-Zcold, using the same colour and line style keys as described in Fig. 9. The uppermost panels display clustering for knot galaxies, while the lowermost panels show clustering for filament galaxies. Additionally, the fractional difference of ξ(r) with respect to the clustering of the parent samples, ξ(r)ref , is also presented. From left to right we include the initial redshift of sample selection, zref = 0.56, followed by the same four redshift snapshots marked by vertical lines in Fig. 6.
Current usage metrics show cumulative count of Article Views (full-text article views including HTML views, PDF and ePub downloads, according to the available data) and Abstracts Views on Vision4Press platform.
Data correspond to usage on the plateform after 2015. The current usage metrics is available 48-96 hours after online publication and is updated daily on week days.
Initial download of the metrics may take a while.