Open Access
Fig. 9
Download original image
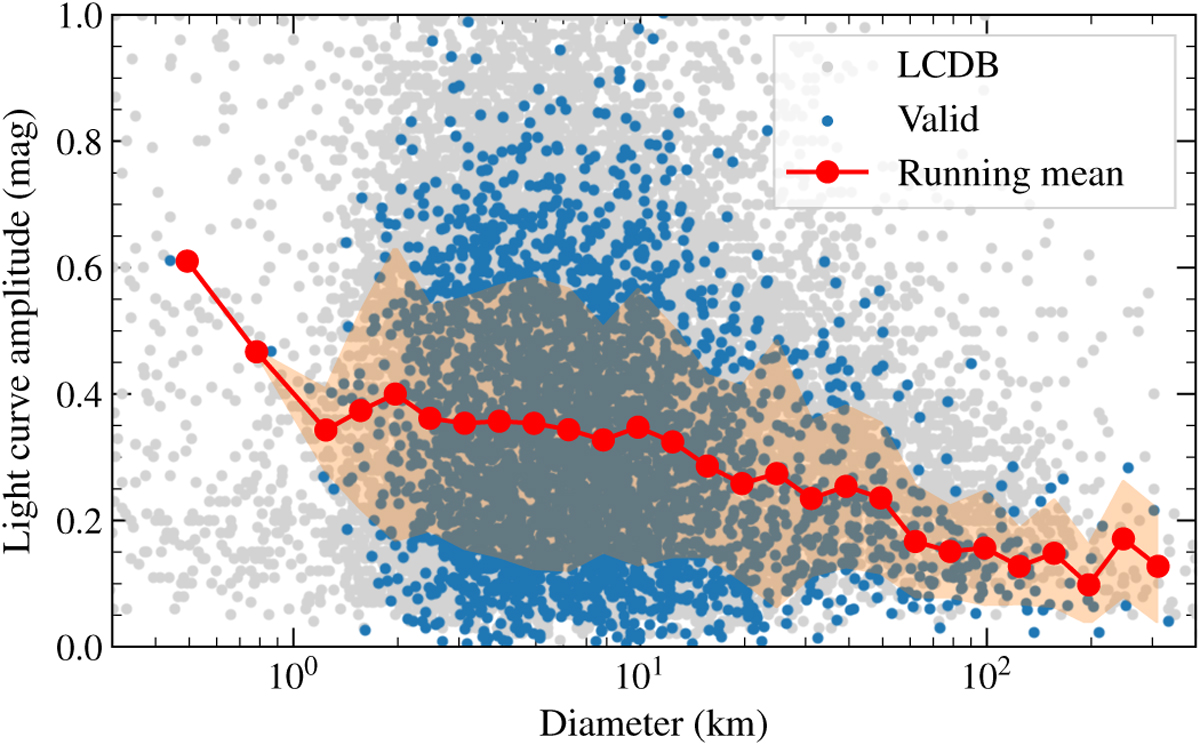
Distribution of the light-curve amplitude as a function of asteroid diameter. The asteroids in LCDB (Warner et al. 2009) are plotted for reference, as well as a running mean (red line) and standard deviation (shaded area).
Current usage metrics show cumulative count of Article Views (full-text article views including HTML views, PDF and ePub downloads, according to the available data) and Abstracts Views on Vision4Press platform.
Data correspond to usage on the plateform after 2015. The current usage metrics is available 48-96 hours after online publication and is updated daily on week days.
Initial download of the metrics may take a while.