Open Access
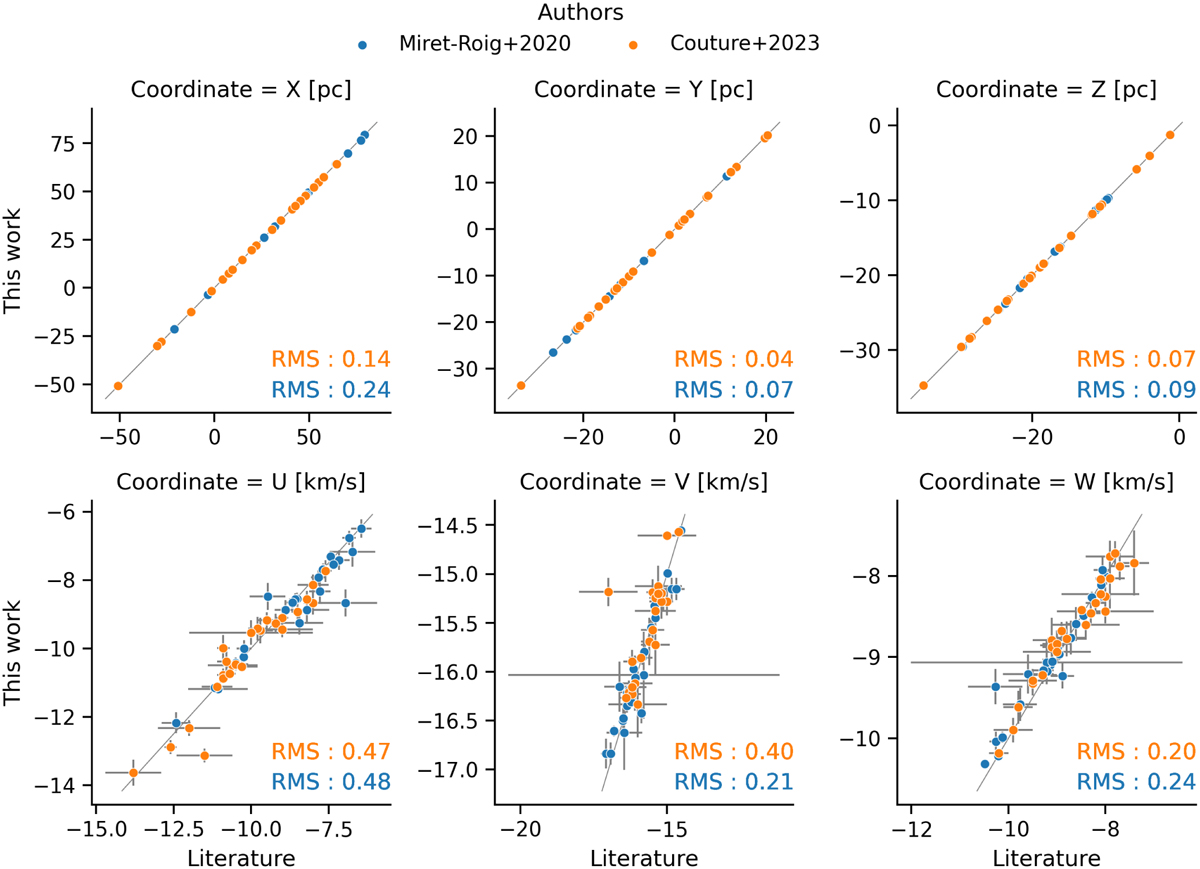
Fig. 6
Download original image
One-to-one comparison of the source-level parameters inferred here and those reported by Couture et al. (2023) and Miret-Roig et al. (2020). The grey line depicts the identity relation. The root-mean-squared value of the differences is also shown on the lower right side of each panel.
Current usage metrics show cumulative count of Article Views (full-text article views including HTML views, PDF and ePub downloads, according to the available data) and Abstracts Views on Vision4Press platform.
Data correspond to usage on the plateform after 2015. The current usage metrics is available 48-96 hours after online publication and is updated daily on week days.
Initial download of the metrics may take a while.