Open Access
Fig. 1
Download original image
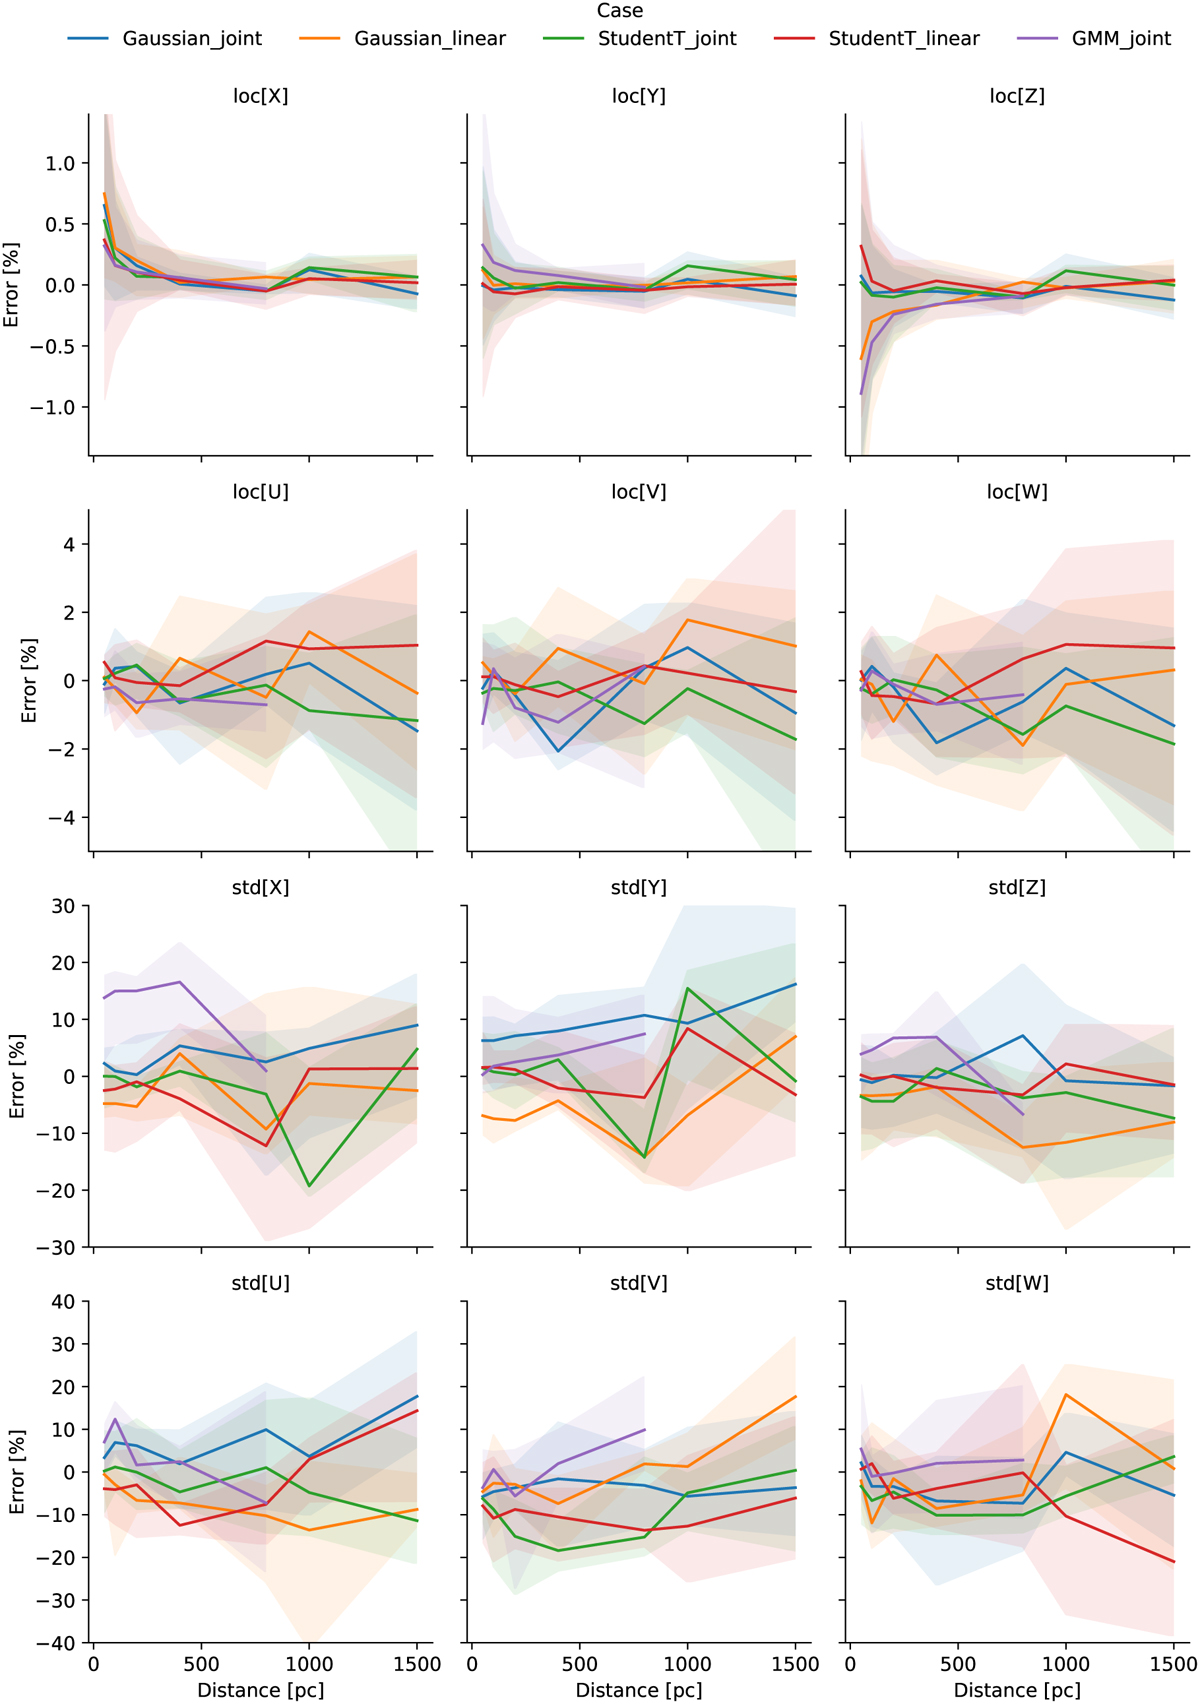
Relative error of the population-level parameters common to all our models as a function of distance. The lines and shaded regions depict the mean and standard deviation of the synthetic clusters with 100 stars.
Current usage metrics show cumulative count of Article Views (full-text article views including HTML views, PDF and ePub downloads, according to the available data) and Abstracts Views on Vision4Press platform.
Data correspond to usage on the plateform after 2015. The current usage metrics is available 48-96 hours after online publication and is updated daily on week days.
Initial download of the metrics may take a while.