Fig. A.4.
Download original image
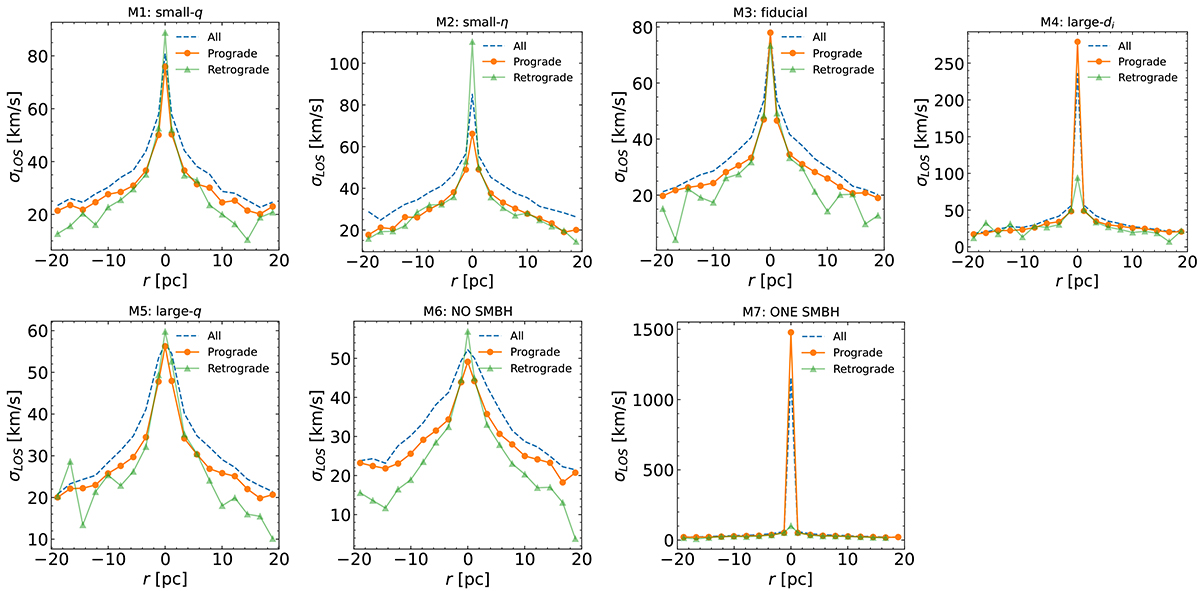
Line-of-sight velocity dispersion of the entire NSC (dashed blue line), of the prograde population (orange line with bullets), and of the retrograde population (green line with triangles). The behaviour of the two populations, and the resulting velocity dispersion of the entire cluster, vary depending on the initial merger configuration.
Current usage metrics show cumulative count of Article Views (full-text article views including HTML views, PDF and ePub downloads, according to the available data) and Abstracts Views on Vision4Press platform.
Data correspond to usage on the plateform after 2015. The current usage metrics is available 48-96 hours after online publication and is updated daily on week days.
Initial download of the metrics may take a while.